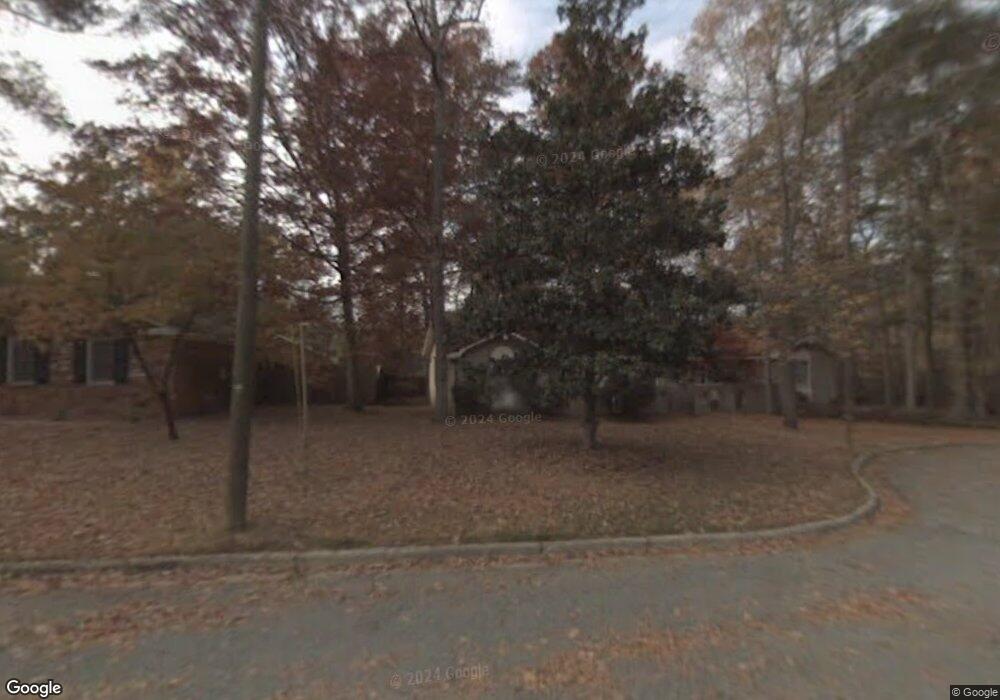
2921 Westchester Ct Augusta, GA 30909
West Augusta NeighborhoodEstimated Value: $294,000 - $349,000
4
Beds
3
Baths
2,059
Sq Ft
$157/Sq Ft
Est. Value
About This Home
This home is located at 2921 Westchester Ct, Augusta, GA 30909 and is currently estimated at $322,857, approximately $156 per square foot. 2921 Westchester Ct is a home located in Richmond County with nearby schools including First Coast Technical Institute, R.B. Hunt Elementary School, and A. Brian Merry Elementary School.
Ownership History
Date
Name
Owned For
Owner Type
Purchase Details
Closed on
Jun 7, 2001
Sold by
Pittman Pamela Larue
Bought by
Pittman Kenneth J
Current Estimated Value
Home Financials for this Owner
Home Financials are based on the most recent Mortgage that was taken out on this home.
Original Mortgage
$96,000
Outstanding Balance
$36,059
Interest Rate
7.11%
Estimated Equity
$286,798
Purchase Details
Closed on
Mar 20, 1998
Sold by
Fry Scharlene Bolden and Wilder Rolston
Bought by
Pittman Pamela Larue
Home Financials for this Owner
Home Financials are based on the most recent Mortgage that was taken out on this home.
Original Mortgage
$91,200
Interest Rate
8.87%
Purchase Details
Closed on
Feb 15, 1993
Sold by
Fry Theran Jan By E
Bought by
Fry Scharlene Bolde
Purchase Details
Closed on
Jul 9, 1992
Sold by
Fry Jason Todd
Bought by
Fry T J
Purchase Details
Closed on
Nov 11, 1987
Sold by
Fry Phyllis Ann and Fry Est
Bought by
Fry Theran Jan
Create a Home Valuation Report for This Property
The Home Valuation Report is an in-depth analysis detailing your home's value as well as a comparison with similar homes in the area
Home Values in the Area
Average Home Value in this Area
Purchase History
| Date | Buyer | Sale Price | Title Company |
|---|---|---|---|
| Pittman Kenneth J | -- | -- | |
| Pittman Pamela Larue | $114,000 | -- | |
| Fry Scharlene Bolde | -- | -- | |
| Fry T J | -- | -- | |
| Fry Theran Jan | -- | -- |
Source: Public Records
Mortgage History
| Date | Status | Borrower | Loan Amount |
|---|---|---|---|
| Open | Pittman Kenneth J | $96,000 | |
| Closed | Pittman Pamela Larue | $91,200 |
Source: Public Records
Tax History Compared to Growth
Tax History
| Year | Tax Paid | Tax Assessment Tax Assessment Total Assessment is a certain percentage of the fair market value that is determined by local assessors to be the total taxable value of land and additions on the property. | Land | Improvement |
|---|---|---|---|---|
| 2025 | $1,202 | $32,262 | $18,000 | $14,262 |
| 2024 | $1,202 | $100,240 | $18,000 | $82,240 |
| 2023 | $2,949 | $100,840 | $18,000 | $82,840 |
| 2022 | $2,693 | $87,018 | $18,000 | $69,018 |
| 2021 | $2,409 | $70,502 | $18,000 | $52,502 |
| 2020 | $1,967 | $57,128 | $14,000 | $43,128 |
| 2019 | $2,082 | $57,128 | $14,000 | $43,128 |
| 2018 | $2,096 | $57,128 | $14,000 | $43,128 |
| 2017 | $2,221 | $57,128 | $14,000 | $43,128 |
| 2016 | $2,222 | $57,128 | $14,000 | $43,128 |
| 2015 | $2,237 | $57,128 | $14,000 | $43,128 |
| 2014 | $2,240 | $57,128 | $14,000 | $43,128 |
Source: Public Records
Map
Nearby Homes
- 2914 Westchester Dr
- 2918 Arrowhead Dr
- 2901 Sussex Rd
- 2920 Sussex Rd
- 2507 Pinebluff Ct
- 2703 Oakbluff Ct
- 2413 Woodbluff Ct
- 2609 Sherborne Ct
- 2924 Mayfair Ct
- 503 Sheffield Dr
- 3084 Westwood Rd
- 3082 Westwood Rd
- 3086 Westwood Rd
- 427 Aumond Rd
- 505 Stratford Dr
- 441 Aumond Rd
- 2695 York Dr
- 3121 Ramsgate Rd
- 26 Mulberry Ln
- 3129 Ramsgate Rd
- 2923 Westchester Ct
- 2925 Westchester Dr
- 2919 Westchester Ct
- 2917 Westchester Ct
- 2915 Westchester Ct
- 2922 Westchester Dr
- 2920 Westchester Dr
- 2913 Westchester Dr
- 307 Kennelworth Place
- 2926 Westchester Dr
- 2924 Westchester Dr
- 305 Kennelworth Place
- 2918 Westchester Dr
- 303 Kennelworth Place
- 2916 Westchester Dr
- 2907 Kipling Dr
- 2909 Kipling Dr
- 2905 Kipling Dr
- 2911 Westchester Dr
- 2911 Kipling Dr