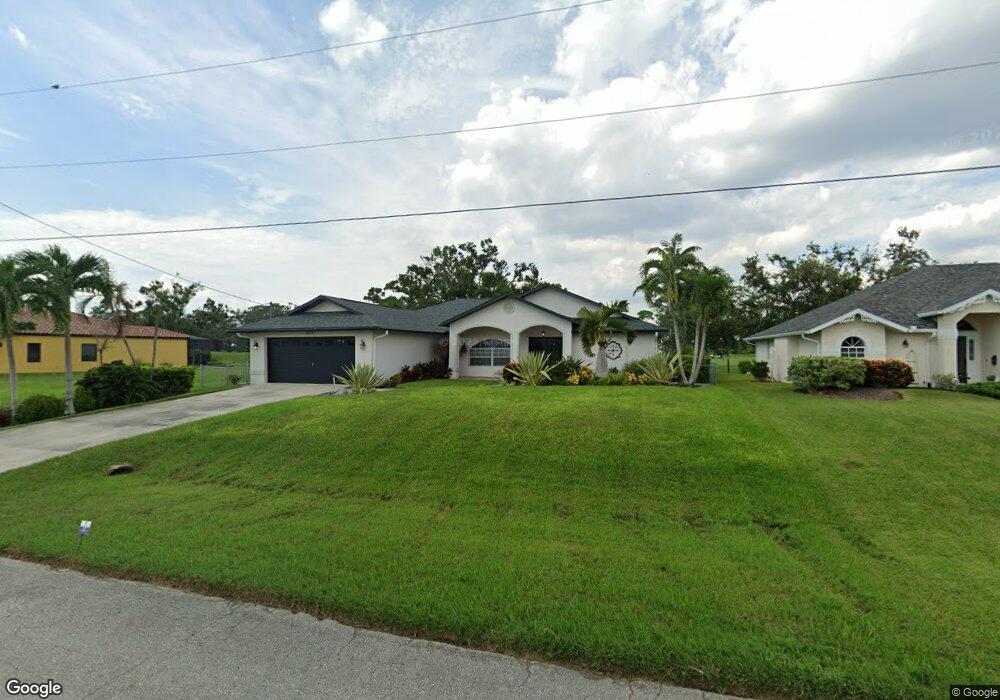
2923 NW 17th Terrace Cape Coral, FL 33993
Burnt Store NeighborhoodEstimated Value: $398,129 - $491,000
3
Beds
2
Baths
1,950
Sq Ft
$227/Sq Ft
Est. Value
About This Home
This home is located at 2923 NW 17th Terrace, Cape Coral, FL 33993 and is currently estimated at $442,782, approximately $227 per square foot. 2923 NW 17th Terrace is a home located in Lee County with nearby schools including Caloosa Elementary School, Dr. Carrie D. Robinson Littleton Elementary School, and Tropic Isles Elementary School.
Ownership History
Date
Name
Owned For
Owner Type
Purchase Details
Closed on
Jan 21, 2011
Sold by
Millenium Investors Llc
Bought by
Allen Robin L
Current Estimated Value
Purchase Details
Closed on
May 13, 2005
Sold by
Hoffman Walter E and Hoffman Ruth E
Bought by
Millennium Investors Llc
Home Financials for this Owner
Home Financials are based on the most recent Mortgage that was taken out on this home.
Original Mortgage
$247,500
Interest Rate
5.8%
Mortgage Type
Unknown
Purchase Details
Closed on
Jul 15, 2003
Sold by
Hoffman Walter E
Bought by
Walter E Hoffman & Ruth E Hoffman Tr
Purchase Details
Closed on
Apr 12, 1995
Sold by
Halvik Raymond M
Bought by
Halvick Raymond M and Halvick John M
Home Financials for this Owner
Home Financials are based on the most recent Mortgage that was taken out on this home.
Original Mortgage
$104,000
Interest Rate
8.59%
Create a Home Valuation Report for This Property
The Home Valuation Report is an in-depth analysis detailing your home's value as well as a comparison with similar homes in the area
Home Values in the Area
Average Home Value in this Area
Purchase History
| Date | Buyer | Sale Price | Title Company |
|---|---|---|---|
| Allen Robin L | $135,000 | Townsend Title Insurance Age | |
| Millennium Investors Llc | $330,000 | Team Title Insurance Inc | |
| Hoffman Walter E | -- | Team Title Insurance Inc | |
| Walter E Hoffman & Ruth E Hoffman Tr | -- | -- | |
| Halvick Raymond M | -- | -- |
Source: Public Records
Mortgage History
| Date | Status | Borrower | Loan Amount |
|---|---|---|---|
| Previous Owner | Millennium Investors Llc | $247,500 | |
| Previous Owner | Halvick Raymond M | $104,000 |
Source: Public Records
Tax History Compared to Growth
Tax History
| Year | Tax Paid | Tax Assessment Tax Assessment Total Assessment is a certain percentage of the fair market value that is determined by local assessors to be the total taxable value of land and additions on the property. | Land | Improvement |
|---|---|---|---|---|
| 2025 | $3,250 | $201,864 | -- | -- |
| 2024 | $3,107 | $196,175 | -- | -- |
| 2023 | $3,107 | $185,461 | $0 | $0 |
| 2022 | $2,950 | $184,414 | $0 | $0 |
| 2021 | $2,986 | $219,658 | $30,333 | $189,325 |
| 2020 | $3,018 | $177,049 | $0 | $0 |
| 2019 | $2,923 | $173,068 | $0 | $0 |
| 2018 | $2,911 | $169,841 | $0 | $0 |
| 2017 | $2,890 | $166,348 | $0 | $0 |
| 2016 | $2,822 | $162,927 | $25,751 | $137,176 |
| 2015 | $3,517 | $161,096 | $25,744 | $135,352 |
| 2014 | $3,281 | $148,201 | $22,836 | $125,365 |
| 2013 | -- | $125,798 | $16,792 | $109,006 |
Source: Public Records
Map
Nearby Homes
- 3101 NW 17th Ln
- 1623 NW 31st Ave
- 1619 NW 31st Ave
- 2928 NW 18th Terrace
- 1633 NW 31st Place
- 3123 NW 17 Ln
- 3123 NW 17th Ln
- 1604 NW 31st Ave
- 2922 NW 19th St
- 2908 NW 19th St
- 1812 NW 30th Place
- 1574 NW 28th Ave
- 1600 NW 31st Ave
- 1626 NW 31st Ave
- 1816 NW 30th Place
- 1821 NW 29th Ave
- 1806 NW 31st Place
- 1818 NW 28th Ave
- 1903 NW 28th Ave
- 1539 NW 28th Ave
- 2919 NW 17th Terrace
- 2940 NW 17th Terrace
- 2915 NW 17th Terrace
- 2931 NW 17th Terrace
- 2924 NW 17th Terrace
- 2920 NW 17th Terrace
- 2916 NW 17th Terrace
- 2911 NW 17th Terrace
- 2935 NW 17th Terrace
- 2912 NW 17th Terrace
- 2939 NW 17th Terrace
- 2907 NW 17th Terrace
- 2936 NW 17th Terrace
- 2943 NW 17th Terrace
- 2903 NW 17th Terrace
- 2902 NW 17th Terrace
- 2944 NW 17th Terrace
- 2949 NW 17th Terrace
- 1707 NW 31st Ave