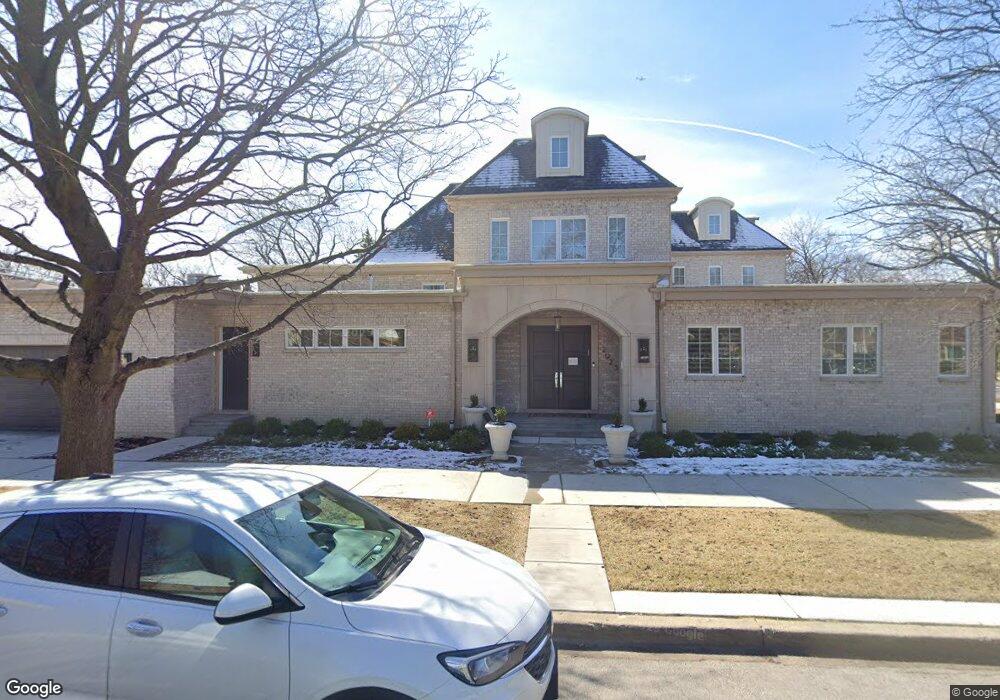
2925 W North Shore Ave Chicago, IL 60645
West Ridge NeighborhoodEstimated Value: $819,066 - $1,627,000
5
Beds
5
Baths
7,893
Sq Ft
$133/Sq Ft
Est. Value
About This Home
This home is located at 2925 W North Shore Ave, Chicago, IL 60645 and is currently estimated at $1,052,767, approximately $133 per square foot. 2925 W North Shore Ave is a home located in Cook County with nearby schools including West Ridge Elementary School, Mather High School, and Yeshivas Tiferes Tzvi Academy.
Ownership History
Date
Name
Owned For
Owner Type
Purchase Details
Closed on
Nov 3, 2022
Sold by
Brandman Samuel
Bought by
Brandman Dalia
Current Estimated Value
Purchase Details
Closed on
Oct 26, 2001
Sold by
Brandman Joseph and Brandman Dalia
Bought by
Brandman Samuel C and Brandman Rita
Purchase Details
Closed on
May 25, 2000
Sold by
Groner Ruth and Groner Julius
Bought by
Brandman Joseph and Brandman Dalia
Home Financials for this Owner
Home Financials are based on the most recent Mortgage that was taken out on this home.
Original Mortgage
$500,000
Interest Rate
8.56%
Mortgage Type
Credit Line Revolving
Purchase Details
Closed on
Dec 23, 1998
Sold by
Groner Ruth
Bought by
Groner Julius and Groner Ruth
Home Financials for this Owner
Home Financials are based on the most recent Mortgage that was taken out on this home.
Original Mortgage
$130,000
Interest Rate
6.83%
Mortgage Type
Purchase Money Mortgage
Create a Home Valuation Report for This Property
The Home Valuation Report is an in-depth analysis detailing your home's value as well as a comparison with similar homes in the area
Home Values in the Area
Average Home Value in this Area
Purchase History
| Date | Buyer | Sale Price | Title Company |
|---|---|---|---|
| Brandman Dalia | -- | Chicago Title | |
| Brandman Samuel C | -- | -- | |
| Brandman Joseph | $400,000 | -- | |
| Groner Julius | -- | -- |
Source: Public Records
Mortgage History
| Date | Status | Borrower | Loan Amount |
|---|---|---|---|
| Previous Owner | Brandman Joseph | $500,000 | |
| Previous Owner | Groner Julius | $130,000 |
Source: Public Records
Tax History Compared to Growth
Tax History
| Year | Tax Paid | Tax Assessment Tax Assessment Total Assessment is a certain percentage of the fair market value that is determined by local assessors to be the total taxable value of land and additions on the property. | Land | Improvement |
|---|---|---|---|---|
| 2024 | $11,327 | $180,000 | $25,395 | $154,605 |
| 2023 | $11,020 | $57,000 | $20,316 | $36,684 |
| 2022 | $11,020 | $57,000 | $20,316 | $36,684 |
| 2021 | $10,792 | $57,000 | $20,316 | $36,684 |
| 2020 | $10,309 | $49,379 | $14,729 | $34,650 |
| 2019 | $12,038 | $63,348 | $14,729 | $48,619 |
| 2018 | $11,835 | $63,348 | $14,729 | $48,619 |
| 2017 | $9,894 | $49,335 | $13,205 | $36,130 |
| 2016 | $9,381 | $49,335 | $13,205 | $36,130 |
| 2015 | $8,560 | $49,335 | $13,205 | $36,130 |
| 2014 | $7,999 | $45,682 | $12,189 | $33,493 |
| 2013 | $8,063 | $46,961 | $12,189 | $34,772 |
Source: Public Records
Map
Nearby Homes
- 6707 N Whipple St
- 6539 N Sacramento Ave
- 6508 N Richmond St Unit 1D
- 6800 N California Ave Unit 3S
- 6800 N California Ave Unit 2I
- 6800 N California Ave Unit 2M
- 3105 W Wallen Ave
- 6517 N California Ave Unit 303
- 6558 N Washtenaw Ave Unit 2
- 6504 N Whipple St
- 6457 N California Ave Unit 3
- 6544 N Albany Ave
- 6451 N California Ave Unit 2
- 6400 N Sacramento Ave Unit 205
- 6833 N Kedzie Ave Unit 1516
- 6712 N Maplewood Ave
- 2614 W Morse Ave
- 6312 N Fairfield Ave Unit 3A
- 6312 N Fairfield Ave Unit 3B
- 6418 N Rockwell St
- 6649 N Richmond St
- 6647 N Richmond St
- 6643 N Richmond St
- 2924 W North Shore Ave
- 2905 W North Shore Ave
- 6650 N Francisco Ave
- 6639 N Richmond St
- 6644 N Francisco Ave
- 6707 N Richmond St
- 2935 W North Shore Ave
- 6652 N Richmond St
- 6635 N Richmond St
- 6700 N Francisco Ave
- 6642 N Francisco Ave
- 6648 N Richmond St
- 6644 N Richmond St
- 6711 N Richmond St
- 6704 N Francisco Ave
- 6700 N Richmond St
- 6633 N Richmond St