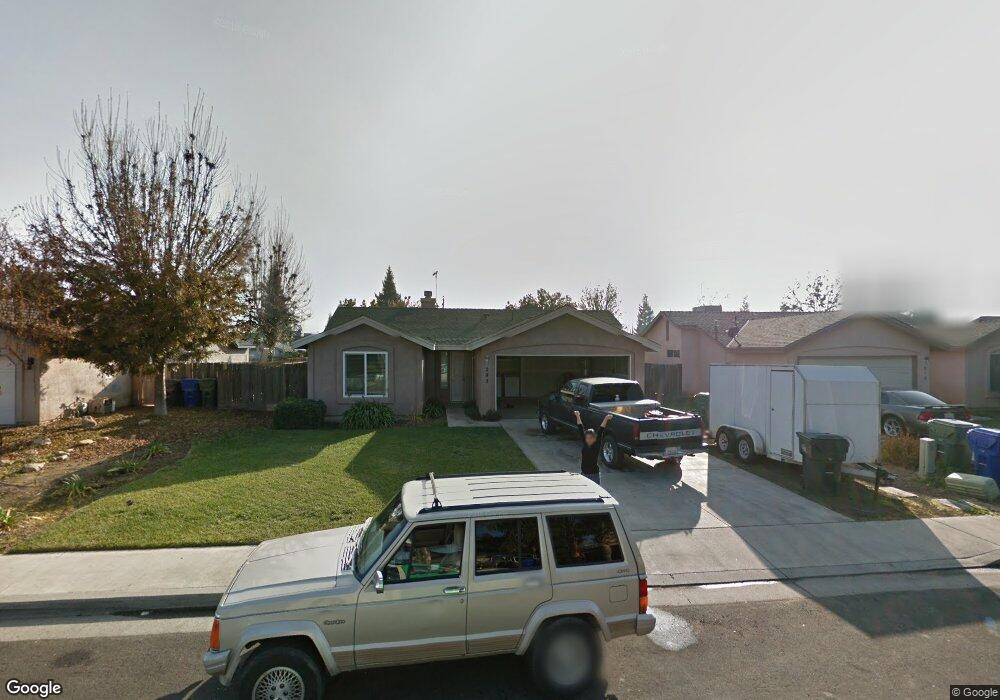
293 Kirsten St Farmersville, CA 93223
Estimated Value: $280,000 - $300,000
3
Beds
2
Baths
1,090
Sq Ft
$265/Sq Ft
Est. Value
About This Home
This home is located at 293 Kirsten St, Farmersville, CA 93223 and is currently estimated at $288,545, approximately $264 per square foot. 293 Kirsten St is a home located in Tulare County with nearby schools including Freedom Elementary School, J.E. Hester Elementary School, and George L. Snowden Elementary School.
Ownership History
Date
Name
Owned For
Owner Type
Purchase Details
Closed on
Aug 21, 2019
Sold by
Gutierrez Otoniel and Gutierrez Maria R
Bought by
Otomar Llc
Current Estimated Value
Purchase Details
Closed on
Jul 28, 2011
Sold by
Gutierrez Otoniel
Bought by
Gutierrez Otoniel and Gutierrez Maria R
Purchase Details
Closed on
May 20, 2011
Sold by
Gutierrez Marta R
Bought by
Gutierrez Otoniel
Purchase Details
Closed on
Mar 17, 2011
Sold by
Us Bank National Association
Bought by
Gutierrez Otoniel
Purchase Details
Closed on
Aug 16, 2010
Sold by
Tedford Kimberly L
Bought by
U S Bank National Association
Purchase Details
Closed on
Oct 23, 1997
Sold by
Castlewood Partners Inc
Bought by
Tedford Kimberly L
Home Financials for this Owner
Home Financials are based on the most recent Mortgage that was taken out on this home.
Original Mortgage
$82,413
Interest Rate
7.13%
Mortgage Type
FHA
Create a Home Valuation Report for This Property
The Home Valuation Report is an in-depth analysis detailing your home's value as well as a comparison with similar homes in the area
Home Values in the Area
Average Home Value in this Area
Purchase History
| Date | Buyer | Sale Price | Title Company |
|---|---|---|---|
| Otomar Llc | -- | None Available | |
| Gutierrez Otoniel | -- | None Available | |
| Gutierrez Otoniel | -- | None Available | |
| Gutierrez Otoniel | -- | Chicago Title Company | |
| Gutierrez Otoniel | $80,500 | None Available | |
| U S Bank National Association | $73,450 | None Available | |
| Tedford Kimberly L | $91,000 | Fidelity National Title Co |
Source: Public Records
Mortgage History
| Date | Status | Borrower | Loan Amount |
|---|---|---|---|
| Previous Owner | Tedford Kimberly L | $82,413 |
Source: Public Records
Tax History Compared to Growth
Tax History
| Year | Tax Paid | Tax Assessment Tax Assessment Total Assessment is a certain percentage of the fair market value that is determined by local assessors to be the total taxable value of land and additions on the property. | Land | Improvement |
|---|---|---|---|---|
| 2025 | $1,230 | $103,131 | $38,433 | $64,698 |
| 2024 | $1,230 | $101,110 | $37,680 | $63,430 |
| 2023 | $1,234 | $99,129 | $36,942 | $62,187 |
| 2022 | $1,150 | $97,186 | $36,218 | $60,968 |
| 2021 | $1,131 | $95,281 | $35,508 | $59,773 |
| 2020 | $1,118 | $94,304 | $35,144 | $59,160 |
| 2019 | $1,132 | $92,455 | $34,455 | $58,000 |
| 2018 | $1,101 | $90,642 | $33,779 | $56,863 |
| 2017 | $1,115 | $88,865 | $33,117 | $55,748 |
| 2016 | $1,057 | $87,123 | $32,468 | $54,655 |
| 2015 | $1,014 | $85,814 | $31,980 | $53,834 |
| 2014 | $1,014 | $84,133 | $31,354 | $52,779 |
Source: Public Records
Map
Nearby Homes
- 391 Teddy St
- 0 Avenue 288
- 1643 Tehama Ave
- 0 Avenue 288
- 322 E Citrus Dr
- 0 Apn 128-030-056-000 Unit 218742
- 0 S Farmersville Blvd Unit 238390
- 896 Farmersville Rd
- 701 Farmersville Rd
- 896 N Mariposa Ave
- 438 N Magnolia Ave
- 371 N Farmersville Blvd
- 732 N Dwight Ave
- 753 N Brundage Ave
- 903 E Ash St
- 885 E Ash St
- 680 E Larry St
- 738 E Larry St
- 209 S Magnolia Ave
- 327 S Farmersville Blvd
- 281 W Kristen St
- 313 Kirsten St
- 281 Kirsten St
- 294 Carolyn St
- 335 Kirsten St
- 314 Carolyn St
- 282 Carolyn St
- 336 Carolyn St
- 292 Kirsten St
- 312 Kirsten St
- 353 W Kristen St
- 280 Kirsten St
- 353 Kirsten St Unit 3
- 334 Kirsten St
- 354 Carolyn St
- 334 W Kristen St
- 379 Kirsten St
- 352 Kirsten St
- 279 W Carolyn St
- 291 Carolyn St