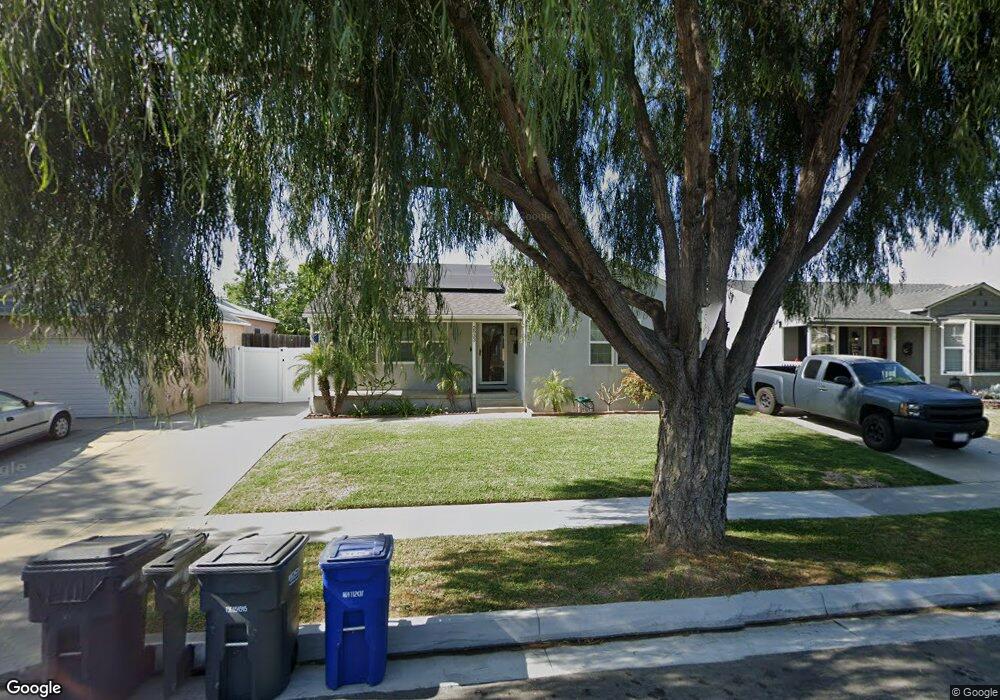
2933 Yearling St Lakewood, CA 90712
Lakewood Mutual NeighborhoodEstimated Value: $826,760 - $859,000
3
Beds
1
Bath
1,210
Sq Ft
$699/Sq Ft
Est. Value
About This Home
This home is located at 2933 Yearling St, Lakewood, CA 90712 and is currently estimated at $845,940, approximately $699 per square foot. 2933 Yearling St is a home located in Los Angeles County with nearby schools including Holmes Elementary School, Hoover Middle School, and Lakewood High School.
Ownership History
Date
Name
Owned For
Owner Type
Purchase Details
Closed on
Apr 21, 2016
Sold by
Phu Thong Q
Bought by
Phu Mark Q and Phu Betty T
Current Estimated Value
Home Financials for this Owner
Home Financials are based on the most recent Mortgage that was taken out on this home.
Original Mortgage
$310,000
Outstanding Balance
$246,679
Interest Rate
3.73%
Mortgage Type
New Conventional
Estimated Equity
$599,261
Purchase Details
Closed on
Mar 27, 2003
Sold by
Nguyen Tristin Trang
Bought by
Phu Thong Q
Home Financials for this Owner
Home Financials are based on the most recent Mortgage that was taken out on this home.
Original Mortgage
$215,000
Interest Rate
5.73%
Purchase Details
Closed on
May 7, 2001
Sold by
Vanatta Robert L and Vanatta Eydee L
Bought by
Phu Mark Q
Home Financials for this Owner
Home Financials are based on the most recent Mortgage that was taken out on this home.
Original Mortgage
$185,600
Interest Rate
7.15%
Create a Home Valuation Report for This Property
The Home Valuation Report is an in-depth analysis detailing your home's value as well as a comparison with similar homes in the area
Home Values in the Area
Average Home Value in this Area
Purchase History
| Date | Buyer | Sale Price | Title Company |
|---|---|---|---|
| Phu Mark Q | -- | Wfg National Title Company | |
| Phu Thong Q | -- | Diversified Title & Escrow S | |
| Phu Mark Q | $232,000 | Continental Title |
Source: Public Records
Mortgage History
| Date | Status | Borrower | Loan Amount |
|---|---|---|---|
| Open | Phu Mark Q | $310,000 | |
| Closed | Phu Thong Q | $215,000 | |
| Previous Owner | Phu Mark Q | $185,600 | |
| Closed | Phu Mark Q | $11,500 |
Source: Public Records
Tax History Compared to Growth
Tax History
| Year | Tax Paid | Tax Assessment Tax Assessment Total Assessment is a certain percentage of the fair market value that is determined by local assessors to be the total taxable value of land and additions on the property. | Land | Improvement |
|---|---|---|---|---|
| 2025 | $6,181 | $458,879 | $356,229 | $102,650 |
| 2024 | $6,181 | $449,883 | $349,245 | $100,638 |
| 2023 | $6,078 | $441,063 | $342,398 | $98,665 |
| 2022 | $5,715 | $432,416 | $335,685 | $96,731 |
| 2021 | $5,602 | $423,938 | $329,103 | $94,835 |
| 2019 | $5,522 | $411,366 | $319,343 | $92,023 |
| 2018 | $5,320 | $403,301 | $313,082 | $90,219 |
| 2016 | $3,752 | $295,297 | $221,858 | $73,439 |
| 2015 | $3,608 | $290,862 | $218,526 | $72,336 |
| 2014 | $3,585 | $285,166 | $214,246 | $70,920 |
Source: Public Records
Map
Nearby Homes
- 2918 Yearling St
- 2912 Yearling St
- 2922 Eckleson St
- 2739 Denmead St
- 5450 N Paramount Blvd Unit 12
- 2523 Allred St
- 4944 Coke Ave
- 3244 Centralia St
- 4559 Levelside Ave
- 5602 Verdura Ave
- 3638 Sandwood St
- 5500 Ackerfield Ave Unit 104
- 2803 Frankel St
- 5530 Ackerfield Ave Unit 206
- 2729 Greentop St
- 4848 Oliva Ave
- 5535 Ackerfield Ave Unit 9
- 1921 E Washington St
- 4740 Pepperwood Ave
- 4328 Deeboyar Ave
- 2927 Yearling St
- 2939 Yearling St
- 2932 Hardwick St
- 2923 Yearling St
- 2943 Yearling St
- 2928 Hardwick St
- 2938 Hardwick St
- 2922 Hardwick St
- 2942 Hardwick St
- 2919 Yearling St
- 2949 Yearling St
- 2932 Yearling St
- 2928 Yearling St
- 2936 Yearling St
- 2918 Hardwick St
- 2948 Hardwick St
- 2922 Yearling St
- 2942 Yearling St
- 2913 Yearling St
- 2948 Yearling St