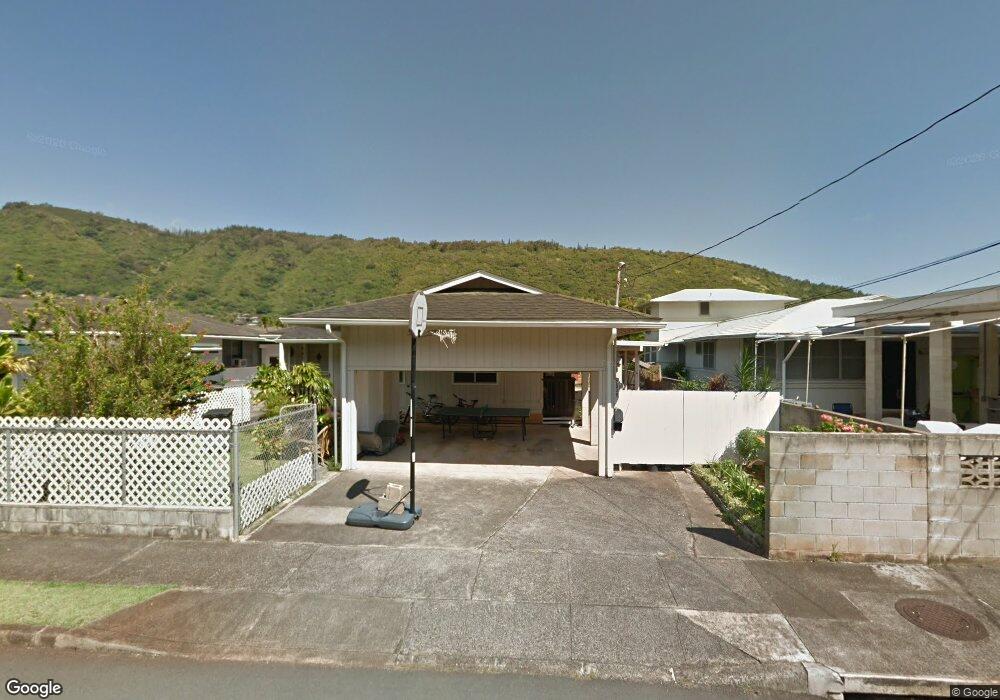
2939 Keoni St Honolulu, HI 96822
Manoa NeighborhoodEstimated Value: $1,206,000 - $2,923,000
5
Beds
3
Baths
2,264
Sq Ft
$856/Sq Ft
Est. Value
About This Home
This home is located at 2939 Keoni St, Honolulu, HI 96822 and is currently estimated at $1,936,881, approximately $855 per square foot. 2939 Keoni St is a home located in Honolulu County with nearby schools including Manoa Elementary School, Robert Louis Stevenson Middle School, and President Theodore Roosevelt High School.
Ownership History
Date
Name
Owned For
Owner Type
Purchase Details
Closed on
Apr 1, 2008
Sold by
Nishi Kay and Nishi Atsuo
Bought by
Saksena Sumeet and Verma Saguna
Current Estimated Value
Home Financials for this Owner
Home Financials are based on the most recent Mortgage that was taken out on this home.
Original Mortgage
$668,800
Outstanding Balance
$413,162
Interest Rate
5.5%
Mortgage Type
Unknown
Estimated Equity
$1,523,719
Purchase Details
Closed on
Apr 5, 2001
Sold by
Osumi Regis Chikato and Osumi Holly Mayumi Urabe
Bought by
Nishi Kay and Nishi Atsuo
Purchase Details
Closed on
May 19, 2000
Sold by
Asato Ellen M
Bought by
Osumi Regis Chikato and Osumi Holly Mayumi Urabe
Home Financials for this Owner
Home Financials are based on the most recent Mortgage that was taken out on this home.
Original Mortgage
$320,000
Interest Rate
7.87%
Create a Home Valuation Report for This Property
The Home Valuation Report is an in-depth analysis detailing your home's value as well as a comparison with similar homes in the area
Home Values in the Area
Average Home Value in this Area
Purchase History
| Date | Buyer | Sale Price | Title Company |
|---|---|---|---|
| Saksena Sumeet | $880,000 | Or | |
| Nishi Kay | $480,000 | -- | |
| Osumi Regis Chikato | $400,000 | -- |
Source: Public Records
Mortgage History
| Date | Status | Borrower | Loan Amount |
|---|---|---|---|
| Open | Saksena Sumeet | $668,800 | |
| Previous Owner | Osumi Regis Chikato | $320,000 | |
| Closed | Osumi Regis Chikato | $40,000 |
Source: Public Records
Tax History Compared to Growth
Tax History
| Year | Tax Paid | Tax Assessment Tax Assessment Total Assessment is a certain percentage of the fair market value that is determined by local assessors to be the total taxable value of land and additions on the property. | Land | Improvement |
|---|---|---|---|---|
| 2025 | $6,249 | $1,834,000 | $1,169,400 | $664,600 |
| 2024 | $6,249 | $1,905,400 | $1,175,800 | $729,600 |
| 2023 | $5,502 | $1,772,000 | $1,137,500 | $634,500 |
| 2022 | $4,684 | $1,438,200 | $958,500 | $479,700 |
| 2021 | $4,301 | $1,328,900 | $933,000 | $395,900 |
| 2020 | $4,100 | $1,271,300 | $958,500 | $312,800 |
| 2019 | $4,367 | $1,327,800 | $958,500 | $369,300 |
| 2018 | $4,409 | $1,339,600 | $920,200 | $419,400 |
| 2017 | $4,549 | $1,379,700 | $894,600 | $485,100 |
| 2016 | $3,947 | $1,207,800 | $830,700 | $377,100 |
| 2015 | $3,768 | $1,156,600 | $766,800 | $389,800 |
| 2014 | $2,248 | $992,100 | $651,800 | $340,300 |
Source: Public Records
Map
Nearby Homes
- 2934 Woodlawn Dr
- 2870 Komaia Place Unit 2870A and 2884
- 3028 Kalehua St
- 2935 Poelua St
- 2626 Hillside Ave
- 2508 Olopua St
- 2626 Manoa Rd
- 3061 Kahaloa Dr
- 2930 Kolomona Place Unit A
- 3059 Woolsey Place
- 3063 Woolsey Place
- 3711 Round Top Dr
- 3360 E Manoa Rd Unit C
- 2897 Kalawao St Unit 61
- 2755 Kalawao St Unit 36
- 2456 Sonoma St
- 3181 Beaumont Woods Place
- 3422 Woodlawn Dr
- 3448 Peneku Place
- 3953 Round Top Dr