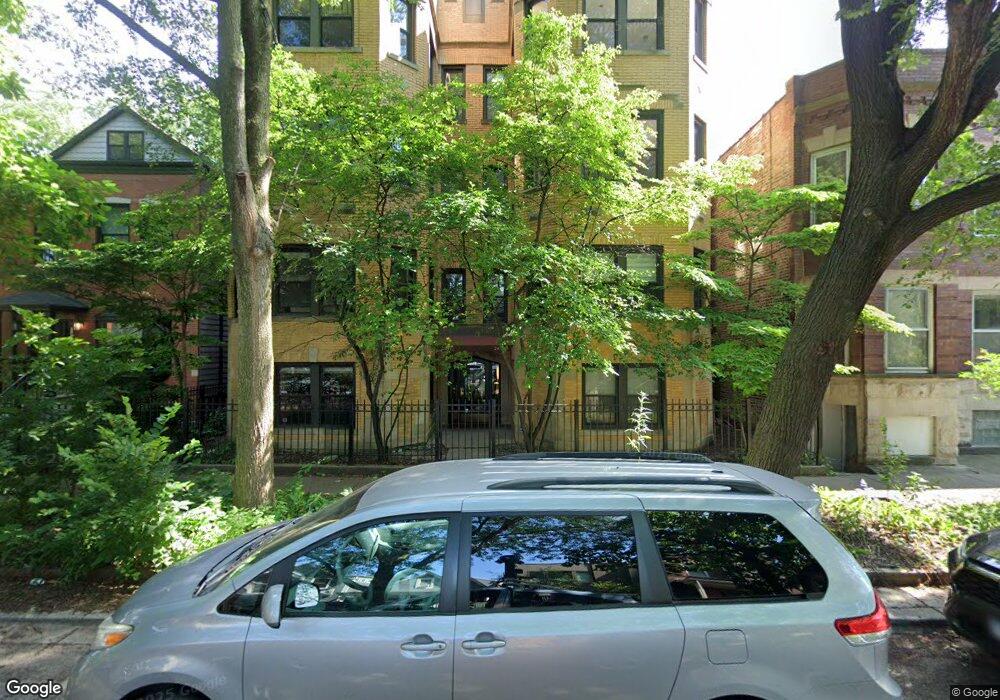
2947 W Belden Ave Unit 29472 Chicago, IL 60647
Logan Square NeighborhoodEstimated Value: $455,624 - $522,000
2
Beds
1
Bath
1,600
Sq Ft
$307/Sq Ft
Est. Value
About This Home
This home is located at 2947 W Belden Ave Unit 29472, Chicago, IL 60647 and is currently estimated at $491,156, approximately $306 per square foot. 2947 W Belden Ave Unit 29472 is a home located in Cook County with nearby schools including Darwin Elementary School and Clemente Community Academy High School.
Ownership History
Date
Name
Owned For
Owner Type
Purchase Details
Closed on
Oct 24, 2019
Sold by
Myers Alexis and Priser Joseph
Bought by
Price Jane M and Cohen Adam W
Current Estimated Value
Home Financials for this Owner
Home Financials are based on the most recent Mortgage that was taken out on this home.
Original Mortgage
$296,000
Outstanding Balance
$261,240
Interest Rate
3.87%
Mortgage Type
New Conventional
Estimated Equity
$229,916
Purchase Details
Closed on
Jun 20, 2008
Sold by
Vizzari Anthony and Wurster Andrea
Bought by
Myers Alexis
Home Financials for this Owner
Home Financials are based on the most recent Mortgage that was taken out on this home.
Original Mortgage
$225,000
Interest Rate
5.96%
Mortgage Type
Purchase Money Mortgage
Purchase Details
Closed on
May 23, 2006
Sold by
Houck William Wright
Bought by
2947-49 W Belden Llc
Create a Home Valuation Report for This Property
The Home Valuation Report is an in-depth analysis detailing your home's value as well as a comparison with similar homes in the area
Home Values in the Area
Average Home Value in this Area
Purchase History
| Date | Buyer | Sale Price | Title Company |
|---|---|---|---|
| Price Jane M | $370,000 | North American Title Company | |
| Myers Alexis | $309,000 | Ticor Title Insurance Co | |
| 2947-49 W Belden Llc | -- | None Available |
Source: Public Records
Mortgage History
| Date | Status | Borrower | Loan Amount |
|---|---|---|---|
| Open | Price Jane M | $296,000 | |
| Previous Owner | Myers Alexis | $225,000 |
Source: Public Records
Tax History Compared to Growth
Tax History
| Year | Tax Paid | Tax Assessment Tax Assessment Total Assessment is a certain percentage of the fair market value that is determined by local assessors to be the total taxable value of land and additions on the property. | Land | Improvement |
|---|---|---|---|---|
| 2024 | $6,117 | $39,415 | $4,781 | $34,634 |
| 2023 | $5,941 | $32,207 | $2,177 | $30,030 |
| 2022 | $5,941 | $32,207 | $2,177 | $30,030 |
| 2021 | $6,498 | $32,206 | $2,177 | $30,029 |
| 2020 | $6,177 | $27,628 | $2,177 | $25,451 |
| 2019 | $5,470 | $30,556 | $2,177 | $28,379 |
| 2018 | $5,221 | $30,556 | $2,177 | $28,379 |
| 2017 | $4,999 | $26,597 | $1,920 | $24,677 |
| 2016 | $4,827 | $26,597 | $1,920 | $24,677 |
| 2015 | $4,393 | $26,597 | $1,920 | $24,677 |
| 2014 | $3,950 | $23,859 | $1,728 | $22,131 |
| 2013 | $3,861 | $23,859 | $1,728 | $22,131 |
Source: Public Records
Map
Nearby Homes
- 2922 W Lyndale St Unit 1
- 2921 W Lyndale St
- 3018 W Lyndale St Unit 3
- 3026 W Lyndale St Unit 2
- 3319 W Fullerton Ave
- 2758 N Mozart St
- 2820 W Lyndale St Unit 2
- 3106 W Fullerton Ave
- 2161 N California Ave Unit 105
- 2036 N Humboldt Blvd Unit 1E
- 2137 N Kedzie Blvd Unit G
- 2139 N Kedzie Blvd Unit 2
- 2026 N Humboldt Blvd
- 2019 N Whipple St Unit 1
- 2330 N Kedzie Blvd
- 2661 W Belden Ave Unit 2
- 2518 N Willetts Ct Unit GS
- 2350 N Kedzie Blvd Unit 1SC
- 2014 N Whipple St
- 2532 N Linden Place Unit 1
- 2947 W Belden Ave Unit 29474
- 2947 W Belden Ave Unit 29473
- 2947 W Belden Ave Unit 29471
- 2947 W Belden Ave Unit 2
- 2947 W Belden Ave Unit 3
- 2947 W Belden Ave Unit 1
- 2949 W Belden Ave Unit 1
- 2949 W Belden Ave Unit G2
- 2949 W Belden Ave Unit 29494
- 2949 W Belden Ave Unit 29492
- 2949 W Belden Ave Unit 29491
- 2949 W Belden Ave Unit G5
- 2949 W Belden Ave Unit 29493
- 2949 W Belden Ave Unit G4
- 2949 W Belden Ave Unit G1
- 2949 W Belden Ave Unit G3
- 2949 W Belden Ave Unit 2
- 2945 W Belden Ave
- 2945 W Belden Ave
- 2953 W Belden Ave Unit 1E