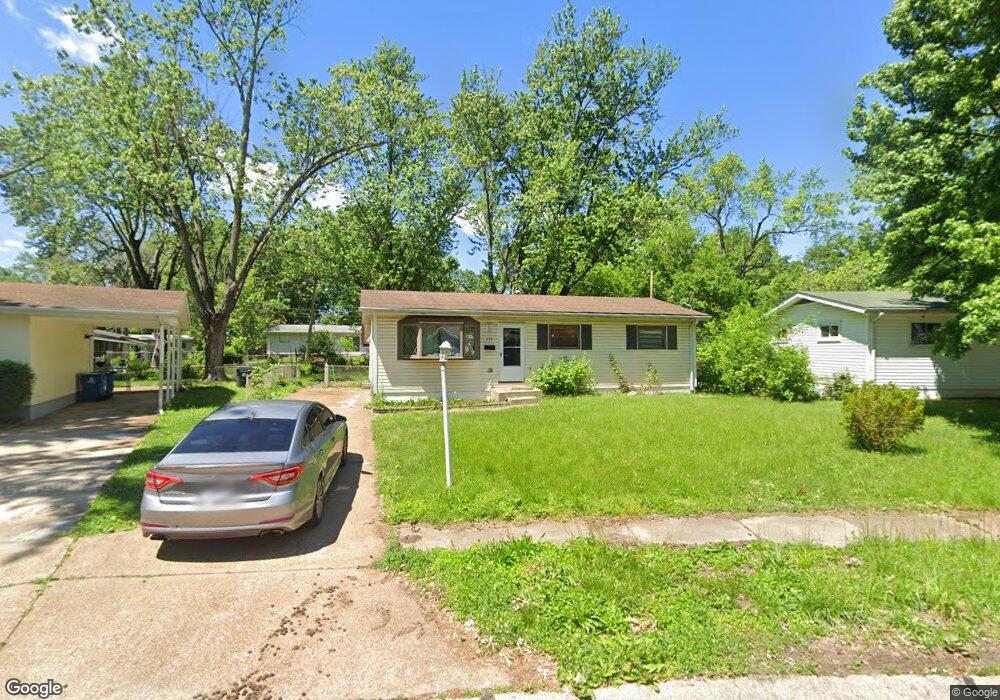
295 Dashwood Dr Saint Louis, MO 63135
Estimated Value: $100,454 - $119,000
3
Beds
1
Bath
960
Sq Ft
$116/Sq Ft
Est. Value
About This Home
This home is located at 295 Dashwood Dr, Saint Louis, MO 63135 and is currently estimated at $111,114, approximately $115 per square foot. 295 Dashwood Dr is a home located in St. Louis County with nearby schools including Vogt Elementary School, Ferguson Middle School, and McCluer High School.
Ownership History
Date
Name
Owned For
Owner Type
Purchase Details
Closed on
Aug 15, 2018
Sold by
Kemi Investing Llc
Bought by
Loftus Damien
Current Estimated Value
Purchase Details
Closed on
Jun 12, 2009
Sold by
U S Bank National Association Nd
Bought by
Kem Investing Llc
Purchase Details
Closed on
Mar 18, 2009
Sold by
Crawford Joyce M and Gibson Joyce Marie Allen
Bought by
U S Bank National Association Nd
Purchase Details
Closed on
Jul 8, 2002
Sold by
Crawford Lawrence T
Bought by
Crawford Joyce M
Purchase Details
Closed on
May 27, 1997
Sold by
Hud
Bought by
Crawford Lawrence T and Crawford Joyce M
Home Financials for this Owner
Home Financials are based on the most recent Mortgage that was taken out on this home.
Original Mortgage
$33,000
Interest Rate
7.85%
Purchase Details
Closed on
Feb 26, 1997
Sold by
Gershman Investment Corp
Bought by
Hud
Create a Home Valuation Report for This Property
The Home Valuation Report is an in-depth analysis detailing your home's value as well as a comparison with similar homes in the area
Home Values in the Area
Average Home Value in this Area
Purchase History
| Date | Buyer | Sale Price | Title Company |
|---|---|---|---|
| Loftus Damien | -- | Old Republic National Title | |
| Kem Investing Llc | $21,000 | None Available | |
| U S Bank National Association Nd | $33,750 | None Available | |
| Crawford Joyce M | -- | -- | |
| Crawford Lawrence T | -- | -- | |
| Hud | -- | -- |
Source: Public Records
Mortgage History
| Date | Status | Borrower | Loan Amount |
|---|---|---|---|
| Previous Owner | Crawford Lawrence T | $33,000 |
Source: Public Records
Tax History Compared to Growth
Tax History
| Year | Tax Paid | Tax Assessment Tax Assessment Total Assessment is a certain percentage of the fair market value that is determined by local assessors to be the total taxable value of land and additions on the property. | Land | Improvement |
|---|---|---|---|---|
| 2025 | $1,385 | $21,460 | $2,950 | $18,510 |
| 2024 | $1,385 | $19,040 | $2,640 | $16,400 |
| 2023 | $1,377 | $19,040 | $2,640 | $16,400 |
| 2022 | $924 | $11,020 | $3,380 | $7,640 |
| 2021 | $895 | $13,960 | $3,380 | $10,580 |
| 2020 | $911 | $10,090 | $1,900 | $8,190 |
| 2019 | $1,143 | $13,000 | $1,900 | $11,100 |
| 2018 | $1,013 | $10,240 | $2,300 | $7,940 |
| 2017 | $993 | $10,240 | $2,300 | $7,940 |
| 2016 | $1,184 | $12,070 | $2,300 | $9,770 |
| 2015 | $1,192 | $12,070 | $2,300 | $9,770 |
| 2014 | $1,059 | $10,580 | $2,070 | $8,510 |
Source: Public Records
Map
Nearby Homes
- 299 Dashwood Dr
- 1006 Highmont Dr
- 29 Godfrey Ln
- 315 S Dellwood Dr
- 141 S Barat Ave
- 135 S Barat Ave
- 125 Forestwood Dr
- 1304 Lang Dr
- 50 Fenwick Dr
- 1321 Highmont Dr
- 18 Mintert Manor Dr
- 49 S Dellwood Ave
- 6155 Emerald Ave
- 215 Bruce Ave
- 33 S Schlueter Ave
- 705 Beardsley Ct
- 1325 Kappel Dr
- 324 Gage Dr
- 109 Florwood Ct
- 38 Lee Ave
- 291 Dashwood Dr
- 947 Forestwood Dr
- 287 Dashwood Dr
- 290 Elmdale Dr
- 286 Elmdale Dr
- 294 Elmdale Dr
- 298 Dashwood Dr
- 282 Elmdale Dr
- 941 Forestwood Dr
- 283 Dashwood Dr
- 294 Dashwood Dr
- 288 Dashwood Dr
- 1007 Forestwood Dr
- 277 Dashwood Dr
- 950 Forestwood Dr
- 946 Forestwood Dr
- 272 Elmdale Dr
- 282 Dashwood Dr
- 940 Forestwood Dr
- 1000 Forestwood Dr