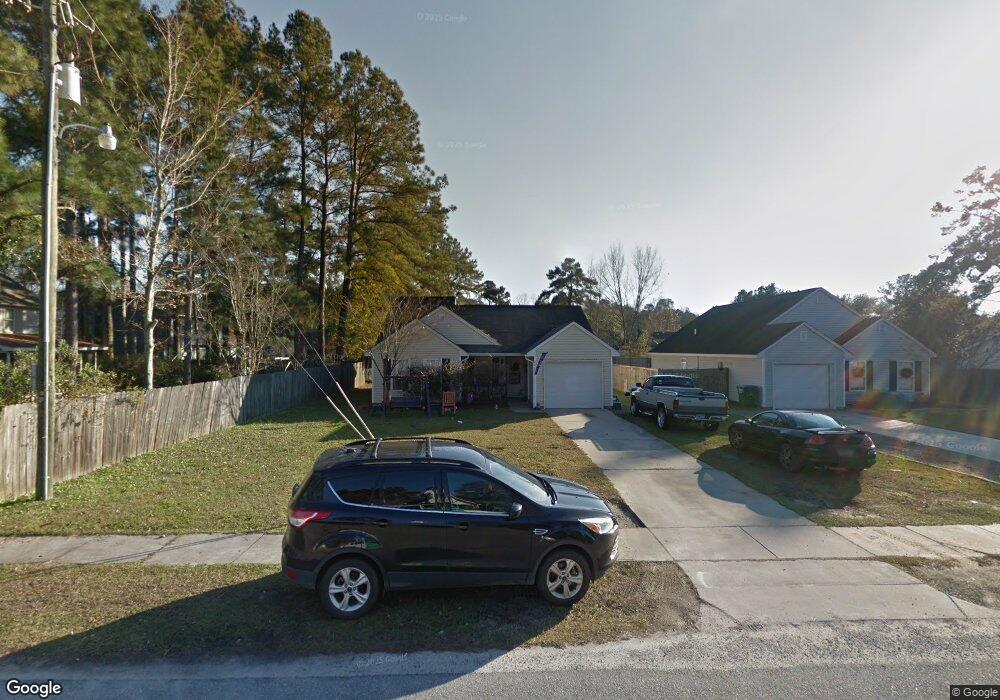
295 Wilson Dr Summerville, SC 29483
Estimated Value: $237,000 - $295,000
3
Beds
2
Baths
1,269
Sq Ft
$203/Sq Ft
Est. Value
About This Home
This home is located at 295 Wilson Dr, Summerville, SC 29483 and is currently estimated at $257,477, approximately $202 per square foot. 295 Wilson Dr is a home located in Dorchester County with nearby schools including Summerville Elementary School, Charles B. DuBose Middle School, and Summerville High School.
Ownership History
Date
Name
Owned For
Owner Type
Purchase Details
Closed on
Sep 27, 2018
Sold by
Adams Sandy and Clark Sandy
Bought by
Clark Sandy
Current Estimated Value
Purchase Details
Closed on
Feb 16, 2011
Sold by
Branch Banking & Trust Company
Bought by
Adams Sandy
Home Financials for this Owner
Home Financials are based on the most recent Mortgage that was taken out on this home.
Original Mortgage
$5,000
Interest Rate
4.77%
Mortgage Type
Negative Amortization
Purchase Details
Closed on
May 24, 2010
Sold by
Corey Parnters Llc
Bought by
Branch Banking & Trust Company
Purchase Details
Closed on
Jan 29, 2008
Sold by
Mcelheney Mark and Sparks Stewart
Bought by
Corey Partners Llc
Home Financials for this Owner
Home Financials are based on the most recent Mortgage that was taken out on this home.
Original Mortgage
$122,000
Interest Rate
6.17%
Mortgage Type
Purchase Money Mortgage
Create a Home Valuation Report for This Property
The Home Valuation Report is an in-depth analysis detailing your home's value as well as a comparison with similar homes in the area
Home Values in the Area
Average Home Value in this Area
Purchase History
| Date | Buyer | Sale Price | Title Company |
|---|---|---|---|
| Clark Sandy | -- | Servicelink | |
| Adams Sandy | $92,000 | -- | |
| Branch Banking & Trust Company | $117,000 | -- | |
| Corey Partners Llc | -- | Attorney |
Source: Public Records
Mortgage History
| Date | Status | Borrower | Loan Amount |
|---|---|---|---|
| Closed | Adams Sandy | $5,000 | |
| Open | Adams Sandy | $88,780 | |
| Previous Owner | Corey Partners Llc | $122,000 |
Source: Public Records
Tax History Compared to Growth
Tax History
| Year | Tax Paid | Tax Assessment Tax Assessment Total Assessment is a certain percentage of the fair market value that is determined by local assessors to be the total taxable value of land and additions on the property. | Land | Improvement |
|---|---|---|---|---|
| 2025 | $1,380 | $7,587 | $3,200 | $4,387 |
| 2024 | $1,380 | $7,587 | $3,200 | $4,387 |
| 2023 | $1,380 | $4,223 | $1,400 | $2,823 |
| 2022 | $1,079 | $4,220 | $1,400 | $2,820 |
| 2021 | $1,198 | $4,220 | $1,400 | $2,820 |
| 2020 | $1,090 | $3,710 | $1,400 | $2,310 |
| 2019 | $2,692 | $3,710 | $1,400 | $2,310 |
| 2018 | $945 | $3,710 | $1,400 | $2,310 |
| 2017 | $929 | $3,710 | $1,400 | $2,310 |
| 2016 | $909 | $3,710 | $1,400 | $2,310 |
| 2015 | $911 | $3,710 | $1,400 | $2,310 |
| 2014 | $896 | $92,700 | $0 | $0 |
| 2013 | -- | $3,710 | $0 | $0 |
Source: Public Records
Map
Nearby Homes
- 122 Five Iron Cir
- 00 Wilson Dr
- 103 Four Iron Dr
- 403 Logan Dr
- 114 Ford Ct
- 96 Four Iron Ct
- 112 Pamela Ln
- 126 Canaberry Cir
- 111 Driver Ave
- 212 Angelica Ave
- 118 Driver Ave
- 117 Rosa St
- 125 White Blvd
- 72 Crossandra Ave
- 444 Longleaf Dr
- 235 Jasmine Dr
- 208 James St
- 81 Crossandra Ave
- 333 O'Leary Cir
- 115 Loblolly Ln
- 297 Wilson Dr
- 204 Four Iron Dr
- 202 Four Iron Dr
- 299 Wilson Dr
- 118 Four Iron Dr
- 200 Four Iron Dr
- 302 Wilson Dr
- 118 4 Iron Dr
- 116 Four Iron Dr
- 301 Wilson Dr
- 208 Four Iron Dr
- 114 Four Iron Dr
- 109 Flynn St
- 303 Wilson Dr
- 230 Wilson Dr
- 210 Four Iron Dr
- 100 Three Iron Dr
- 229 Wilson Dr
- 108 Flynn St
- 112 Four Iron Dr