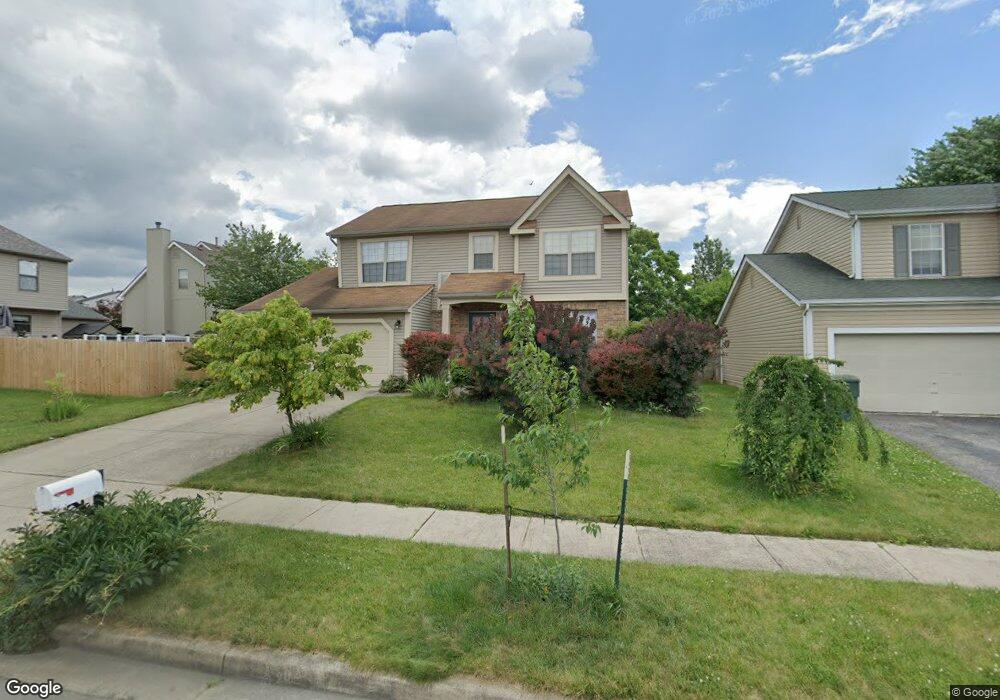
2960 Ambarwent Rd Reynoldsburg, OH 43068
Estimated Value: $329,126 - $360,000
4
Beds
3
Baths
1,711
Sq Ft
$201/Sq Ft
Est. Value
About This Home
This home is located at 2960 Ambarwent Rd, Reynoldsburg, OH 43068 and is currently estimated at $343,282, approximately $200 per square foot. 2960 Ambarwent Rd is a home located in Fairfield County with nearby schools including Tussing Elementary School, Harmon Middle School, and Pickerington Ridgeview Junior High School.
Ownership History
Date
Name
Owned For
Owner Type
Purchase Details
Closed on
Sep 16, 2013
Sold by
Freeman Amir and Davis Sheikhi Lisa L
Bought by
Freeman Sean Amir and Davis Sheikhi Lisa L
Current Estimated Value
Home Financials for this Owner
Home Financials are based on the most recent Mortgage that was taken out on this home.
Original Mortgage
$121,100
Outstanding Balance
$61,084
Interest Rate
4.3%
Mortgage Type
New Conventional
Estimated Equity
$282,198
Purchase Details
Closed on
Jul 23, 2004
Sold by
Sparks Kelly W and Sparks Kimberly D
Bought by
Sheikhi Seyed Amir and Davis Sheikhi Lisa L
Home Financials for this Owner
Home Financials are based on the most recent Mortgage that was taken out on this home.
Original Mortgage
$128,800
Interest Rate
4.87%
Mortgage Type
Purchase Money Mortgage
Purchase Details
Closed on
May 24, 1995
Sold by
Rockford Homes Inc
Bought by
Sparks Kelly W and Sparks Kimberly D
Home Financials for this Owner
Home Financials are based on the most recent Mortgage that was taken out on this home.
Original Mortgage
$108,523
Interest Rate
8.4%
Mortgage Type
FHA
Create a Home Valuation Report for This Property
The Home Valuation Report is an in-depth analysis detailing your home's value as well as a comparison with similar homes in the area
Home Values in the Area
Average Home Value in this Area
Purchase History
| Date | Buyer | Sale Price | Title Company |
|---|---|---|---|
| Freeman Sean Amir | -- | None Available | |
| Sheikhi Seyed Amir | $161,000 | -- | |
| Sparks Kelly W | $116,220 | -- |
Source: Public Records
Mortgage History
| Date | Status | Borrower | Loan Amount |
|---|---|---|---|
| Open | Freeman Sean Amir | $121,100 | |
| Closed | Sheikhi Seyed Amir | $128,800 | |
| Closed | Sparks Kelly W | $108,523 | |
| Closed | Sheikhi Seyed Amir | $32,200 |
Source: Public Records
Tax History Compared to Growth
Tax History
| Year | Tax Paid | Tax Assessment Tax Assessment Total Assessment is a certain percentage of the fair market value that is determined by local assessors to be the total taxable value of land and additions on the property. | Land | Improvement |
|---|---|---|---|---|
| 2024 | $7,545 | $76,640 | $12,700 | $63,940 |
| 2023 | $2,982 | $76,640 | $12,700 | $63,940 |
| 2022 | $2,989 | $76,640 | $12,700 | $63,940 |
| 2021 | $2,656 | $58,790 | $9,770 | $49,020 |
| 2020 | $2,686 | $58,790 | $9,770 | $49,020 |
| 2019 | $2,705 | $58,790 | $9,770 | $49,020 |
| 2018 | $2,354 | $45,990 | $8,950 | $37,040 |
| 2017 | $2,356 | $45,180 | $8,140 | $37,040 |
| 2016 | $2,338 | $45,180 | $8,140 | $37,040 |
| 2015 | $2,234 | $41,040 | $8,140 | $32,900 |
| 2014 | $2,200 | $41,040 | $8,140 | $32,900 |
| 2013 | $2,200 | $41,040 | $8,140 | $32,900 |
Source: Public Records
Map
Nearby Homes
- 3099 Ambarwent Rd
- 3072 Bocastle Ct
- 3021 Sumner Dr
- 6926 Bennell Dr
- 3124 Creighton Place
- 3188 Creighton Place
- 6775 Centennial Dr
- 7350 Aplin Dr
- 3292 Draycott Ct
- 3265 O'Heagra Dr
- 2826-2828 Continental Dr
- 3133 Earlington Ln
- 3205 Mahaffey Ct
- 3212 Southern Hills Dr
- 3233 Mahaffey Ct
- 3161 Innisbrook Ct
- 7287 Candlestone Dr
- 2909 Princeville Dr
- 3358 Cargin Ct
- 6605 Hancock Ct
- 2966 Ambarwent Rd
- 7037 Furrow Rd
- 7043 Furrow Rd
- 2972 Ambarwent Rd
- 7049 Furrow Rd
- 3011 Hollybank Rd
- 3005 Hollybank Rd
- 3017 Hollybank Rd
- 2978 Ambarwent Rd
- 2961 Ambarwent Rd
- 2955 Ambarwent Rd
- 2967 Ambarwent Rd
- 3023 Hollybank Rd
- 2949 Ambarwent Rd
- 2973 Ambarwent Rd
- 2984 Ambarwent Rd
- 2930 Ambarwent Rd
- 2943 Ambarwent Rd
- 2979 Ambarwent Rd
- 3029 Hollybank Rd