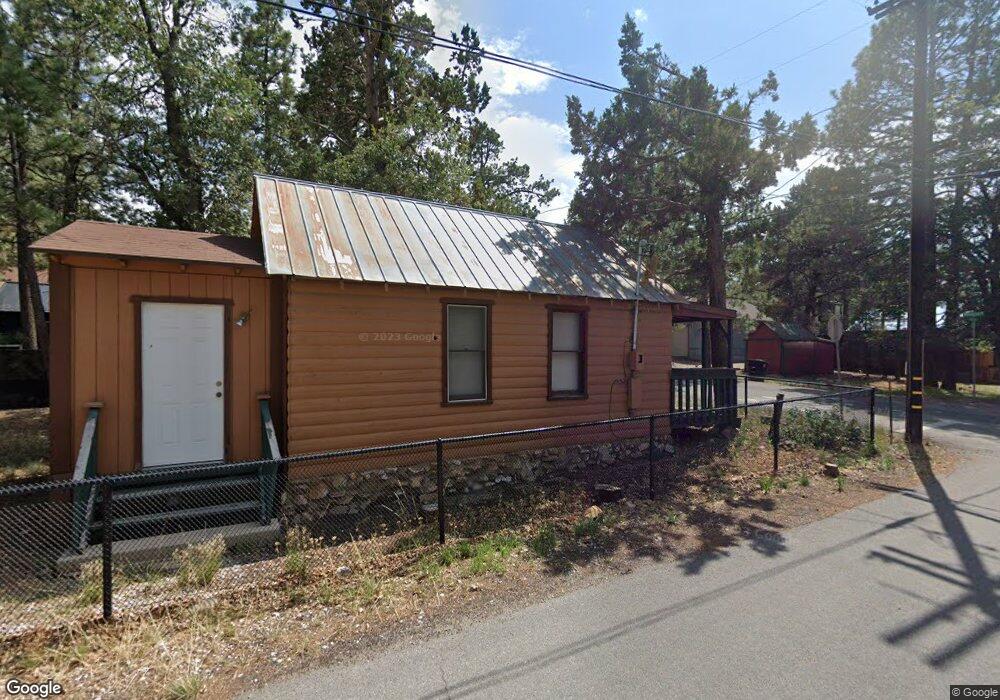
297 Wabash Ln Sugarloaf, CA 92386
Estimated Value: $197,000 - $246,528
2
Beds
1
Bath
440
Sq Ft
$503/Sq Ft
Est. Value
About This Home
This home is located at 297 Wabash Ln, Sugarloaf, CA 92386 and is currently estimated at $221,382, approximately $503 per square foot. 297 Wabash Ln is a home with nearby schools including Baldwin Lane Elementary School, Big Bear Middle School, and Big Bear High School.
Ownership History
Date
Name
Owned For
Owner Type
Purchase Details
Closed on
Jan 31, 2007
Sold by
Gulliford Clark
Bought by
Medina Alex Mark
Current Estimated Value
Purchase Details
Closed on
Dec 8, 2000
Sold by
Johnston Clifford R
Bought by
Gulliford Clark and Gulliford Stephanie J
Home Financials for this Owner
Home Financials are based on the most recent Mortgage that was taken out on this home.
Original Mortgage
$44,500
Interest Rate
7.41%
Purchase Details
Closed on
Aug 27, 1999
Sold by
Colletta Philip D
Bought by
Johnston Clifford R and Johnston Linda
Create a Home Valuation Report for This Property
The Home Valuation Report is an in-depth analysis detailing your home's value as well as a comparison with similar homes in the area
Home Values in the Area
Average Home Value in this Area
Purchase History
| Date | Buyer | Sale Price | Title Company |
|---|---|---|---|
| Medina Alex Mark | $135,000 | Fidelity National Title Ins | |
| Gulliford Clark | $49,500 | Commonwealth Land Title Co | |
| Johnston Clifford R | $32,000 | Commonwealth Land Title Co |
Source: Public Records
Mortgage History
| Date | Status | Borrower | Loan Amount |
|---|---|---|---|
| Previous Owner | Gulliford Clark | $44,500 |
Source: Public Records
Tax History Compared to Growth
Tax History
| Year | Tax Paid | Tax Assessment Tax Assessment Total Assessment is a certain percentage of the fair market value that is determined by local assessors to be the total taxable value of land and additions on the property. | Land | Improvement |
|---|---|---|---|---|
| 2025 | $3,132 | $180,873 | $87,087 | $93,786 |
| 2024 | $3,132 | $177,326 | $85,379 | $91,947 |
| 2023 | $3,031 | $173,849 | $83,705 | $90,144 |
| 2022 | $2,913 | $170,440 | $82,064 | $88,376 |
| 2021 | $2,758 | $158,620 | $32,000 | $126,620 |
| 2020 | $2,277 | $113,300 | $30,900 | $82,400 |
| 2019 | $2,212 | $110,000 | $30,000 | $80,000 |
| 2018 | $1,962 | $92,500 | $28,900 | $63,600 |
| 2017 | $1,855 | $86,100 | $26,900 | $59,200 |
| 2016 | $1,780 | $82,000 | $25,600 | $56,400 |
| 2015 | $1,736 | $80,000 | $25,000 | $55,000 |
| 2014 | $1,621 | $71,000 | $20,000 | $51,000 |
Source: Public Records
Map
Nearby Homes