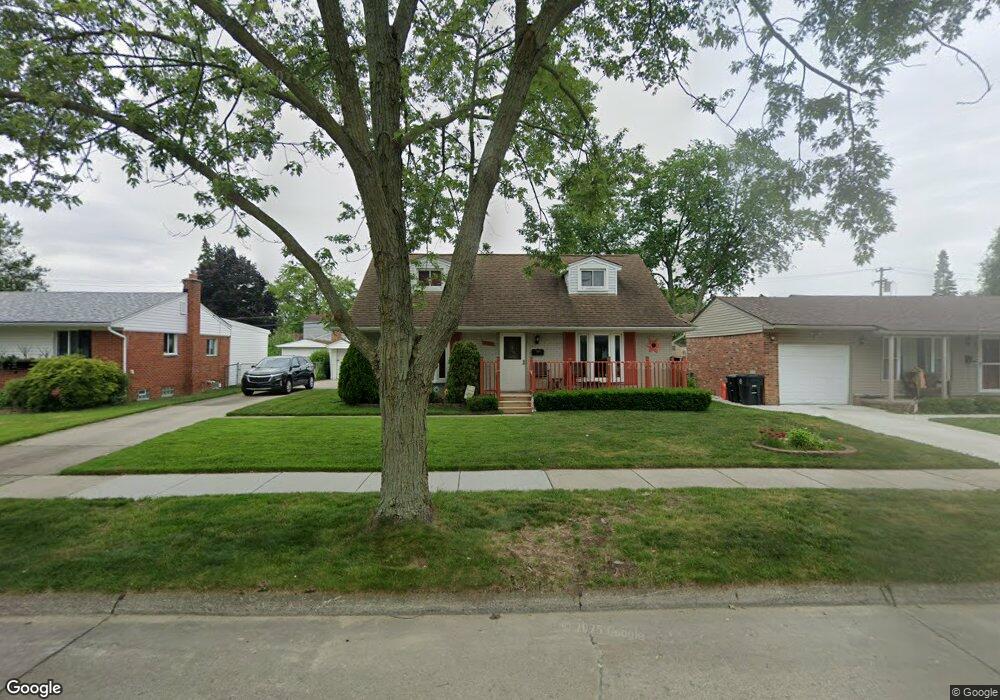
29843 Lori St Livonia, MI 48154
Estimated Value: $287,936 - $335,000
3
Beds
2
Baths
1,341
Sq Ft
$229/Sq Ft
Est. Value
About This Home
This home is located at 29843 Lori St, Livonia, MI 48154 and is currently estimated at $306,734, approximately $228 per square foot. 29843 Lori St is a home located in Wayne County with nearby schools including Roosevelt Elementary School, Emerson Middle School, and Cooper Upper Elementary School.
Ownership History
Date
Name
Owned For
Owner Type
Purchase Details
Closed on
Aug 11, 2011
Sold by
Secretary Of Housing & Urban Development
Bought by
Dallape James and Dallape Sherry
Current Estimated Value
Purchase Details
Closed on
Jun 18, 2010
Sold by
Wells Fargo Bank Na
Bought by
The Secretary Of Housing & Urban Develop
Purchase Details
Closed on
Dec 17, 2009
Sold by
Fawkes Ryan T
Bought by
Wells Fargo Bank Na
Purchase Details
Closed on
May 5, 2006
Sold by
Vanpatten William C and Vanpatten Marlene M
Bought by
Fawkes Ryan T
Create a Home Valuation Report for This Property
The Home Valuation Report is an in-depth analysis detailing your home's value as well as a comparison with similar homes in the area
Home Values in the Area
Average Home Value in this Area
Purchase History
| Date | Buyer | Sale Price | Title Company |
|---|---|---|---|
| Dallape James | $83,500 | None Available | |
| The Secretary Of Housing & Urban Develop | -- | None Available | |
| Wells Fargo Bank Na | $201,616 | None Available | |
| Fawkes Ryan T | $190,000 | Multiple |
Source: Public Records
Tax History Compared to Growth
Tax History
| Year | Tax Paid | Tax Assessment Tax Assessment Total Assessment is a certain percentage of the fair market value that is determined by local assessors to be the total taxable value of land and additions on the property. | Land | Improvement |
|---|---|---|---|---|
| 2025 | $1,606 | $126,900 | $0 | $0 |
| 2024 | $1,606 | $121,200 | $0 | $0 |
| 2023 | $1,533 | $115,200 | $0 | $0 |
| 2022 | $2,691 | $105,800 | $0 | $0 |
| 2021 | $2,614 | $99,800 | $0 | $0 |
| 2019 | $2,508 | $85,700 | $0 | $0 |
| 2018 | $1,296 | $79,400 | $0 | $0 |
| 2017 | $2,293 | $77,100 | $0 | $0 |
| 2016 | $2,411 | $73,100 | $0 | $0 |
| 2015 | $5,700 | $63,840 | $0 | $0 |
| 2012 | -- | $53,940 | $16,440 | $37,500 |
Source: Public Records
Map
Nearby Homes
- 29831 Oakley St
- 29631 Lyndon St
- 14962 Beatrice St
- 29760 Hoy St
- 30831 Lyndon St
- 30261 Buckingham St
- 14127 Hillcrest St
- 29109 Perth St
- 14292 Hubbell St
- 31221 Lyndon St
- 31126 Grennada St
- 14334 Sunbury St
- 14154 Hubbell St
- 14164 Bainbridge St
- 15608 Hidden Ln
- 15345 Bainbridge St
- 31005 Roycroft St
- 14327 Arden St
- 28692 Bayberry Park Dr
- 14563 Melrose St