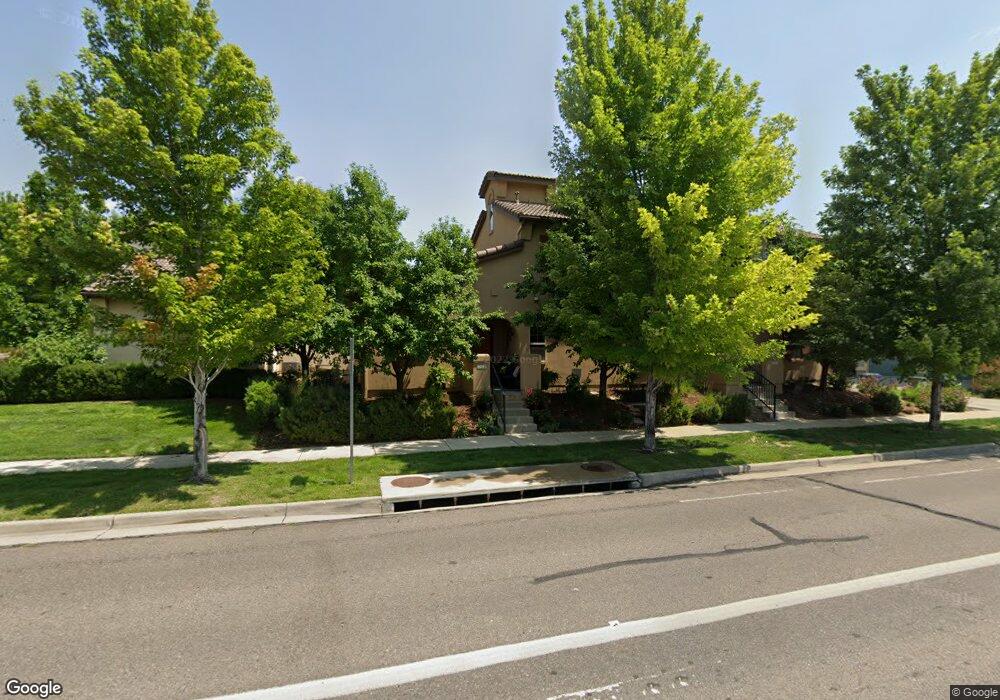
2988 Fulton St Denver, CO 80238
Central Park NeighborhoodEstimated Value: $423,000 - $450,000
2
Beds
2
Baths
1,132
Sq Ft
$382/Sq Ft
Est. Value
About This Home
This home is located at 2988 Fulton St, Denver, CO 80238 and is currently estimated at $432,242, approximately $381 per square foot. 2988 Fulton St is a home located in Denver County with nearby schools including Westerly Creek Elementary, William (Bill) Roberts ECE-8 School, and Swigert International School.
Ownership History
Date
Name
Owned For
Owner Type
Purchase Details
Closed on
Apr 27, 2010
Sold by
Aurora Loan Services Llc
Bought by
Johnson Kenneth
Current Estimated Value
Home Financials for this Owner
Home Financials are based on the most recent Mortgage that was taken out on this home.
Original Mortgage
$207,209
Outstanding Balance
$141,042
Interest Rate
5.37%
Mortgage Type
FHA
Estimated Equity
$291,200
Purchase Details
Closed on
Jan 7, 2010
Sold by
Austin Craig A and Austin Alex L
Bought by
Aurora Loan Services Llc
Purchase Details
Closed on
May 6, 2009
Sold by
Austin Alexander L
Bought by
Austin Craig A
Purchase Details
Closed on
Oct 16, 2006
Sold by
Artisan Plazas Llc
Bought by
Austin Craig A and Austin Alex L
Home Financials for this Owner
Home Financials are based on the most recent Mortgage that was taken out on this home.
Original Mortgage
$246,690
Interest Rate
8.25%
Mortgage Type
Purchase Money Mortgage
Create a Home Valuation Report for This Property
The Home Valuation Report is an in-depth analysis detailing your home's value as well as a comparison with similar homes in the area
Home Values in the Area
Average Home Value in this Area
Purchase History
| Date | Buyer | Sale Price | Title Company |
|---|---|---|---|
| Johnson Kenneth | $210,000 | Assured Title | |
| Aurora Loan Services Llc | -- | None Available | |
| Austin Craig A | -- | None Available | |
| Austin Craig A | $259,674 | Land Title Guarantee Company |
Source: Public Records
Mortgage History
| Date | Status | Borrower | Loan Amount |
|---|---|---|---|
| Open | Johnson Kenneth | $207,209 | |
| Previous Owner | Austin Craig A | $246,690 |
Source: Public Records
Tax History Compared to Growth
Tax History
| Year | Tax Paid | Tax Assessment Tax Assessment Total Assessment is a certain percentage of the fair market value that is determined by local assessors to be the total taxable value of land and additions on the property. | Land | Improvement |
|---|---|---|---|---|
| 2024 | $3,979 | $27,200 | $2,890 | $24,310 |
| 2023 | $3,926 | $27,200 | $2,890 | $24,310 |
| 2022 | $3,555 | $25,160 | $2,620 | $22,540 |
| 2021 | $3,555 | $25,890 | $2,700 | $23,190 |
| 2020 | $3,369 | $25,150 | $2,700 | $22,450 |
| 2019 | $3,318 | $25,150 | $2,700 | $22,450 |
| 2018 | $3,000 | $21,810 | $2,330 | $19,480 |
| 2017 | $2,996 | $21,810 | $2,330 | $19,480 |
| 2016 | $2,697 | $19,480 | $1,926 | $17,554 |
| 2015 | $2,625 | $19,480 | $1,926 | $17,554 |
| 2014 | $2,314 | $16,640 | $1,552 | $15,088 |
Source: Public Records
Map
Nearby Homes
- 3143 Elmira St
- 3212 Fulton St
- 2880 Emporia Ct
- 3421 Florence Way
- 10138 E 28th Ave
- 10631 E 28th Ave
- 9833 E 26th Ave Unit 9833
- 2732 Dallas St
- 10159 E 25th Dr
- 10490 E 26th Ave
- 2572 Iola St
- 9171 E 29th Place
- 2356 Elmira St
- 2356 Emporia St
- 2348 Emporia St
- 3565 Beeler Ct
- 2285 Fulton St
- 10950 E 26th Ave
- 9138 E 35th Place
- 2226 Fulton St
- 2984 Fulton St
- 10114 E 29th Dr
- 10124 E 29th Dr
- 10144 E 29th Dr
- 10118 E 29th Dr
- 10128 E 29th Dr
- 10134 E 29th Dr
- 10138 E 29th Dr
- 2997 Fulton St
- 2972 Fulton St
- 2964 Fulton St
- 2982 Fulton St Unit 2992
- 2983 Fulton St
- 10094 Martin Luther King Blvd
- 10094 Martin Luther King Blvd Unit B
- 2981 Fulton St
- 10158 E 29th Dr
- 2962 Fulton St
- 10154 E 29th Dr
- 2999 Fulton St