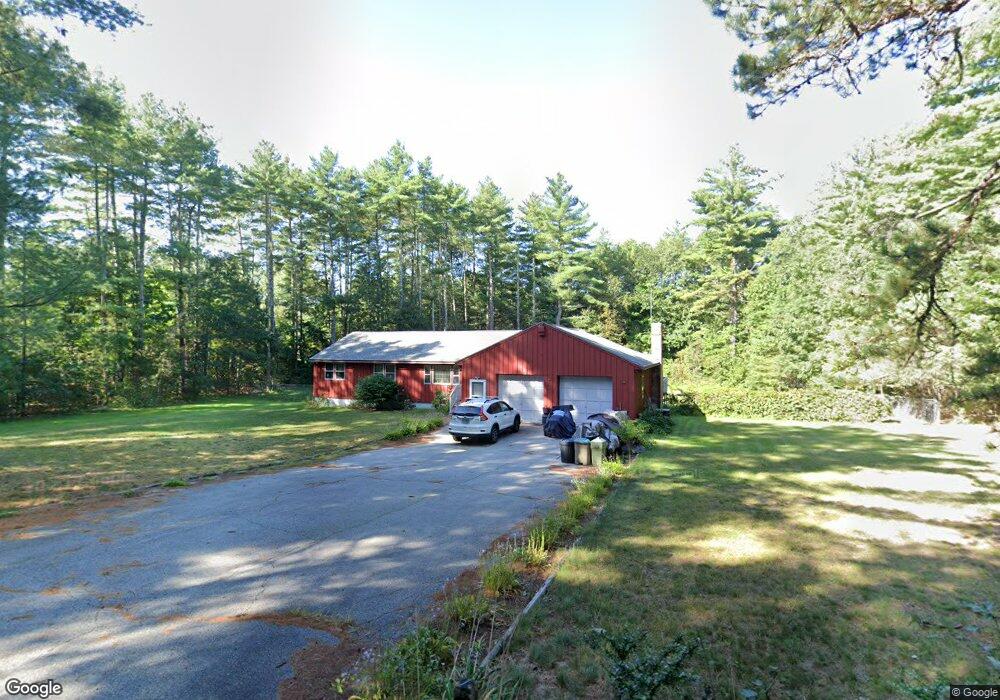
3 Depot Rd Nashua, NH 03062
Southwest Nashua NeighborhoodEstimated Value: $561,000 - $630,000
3
Beds
3
Baths
1,668
Sq Ft
$355/Sq Ft
Est. Value
About This Home
This home is located at 3 Depot Rd, Nashua, NH 03062 and is currently estimated at $592,744, approximately $355 per square foot. 3 Depot Rd is a home located in Hillsborough County with nearby schools including Main Dunstable School, Elm Street Middle School, and Nashua High School South.
Ownership History
Date
Name
Owned For
Owner Type
Purchase Details
Closed on
Oct 24, 2003
Sold by
Merritt Thomas B and Merritt Mary Jane
Bought by
Unknown
Current Estimated Value
Home Financials for this Owner
Home Financials are based on the most recent Mortgage that was taken out on this home.
Original Mortgage
$312,000
Outstanding Balance
$144,998
Interest Rate
6.15%
Estimated Equity
$447,746
Purchase Details
Closed on
Apr 1, 1996
Sold by
Merritt Thomas B and Merritt Mary Jane
Bought by
Merritt Theodore B
Home Financials for this Owner
Home Financials are based on the most recent Mortgage that was taken out on this home.
Original Mortgage
$76,000
Interest Rate
6.9%
Purchase Details
Closed on
Jan 29, 1990
Bought by
Hafemann Charles R
Create a Home Valuation Report for This Property
The Home Valuation Report is an in-depth analysis detailing your home's value as well as a comparison with similar homes in the area
Home Values in the Area
Average Home Value in this Area
Purchase History
| Date | Buyer | Sale Price | Title Company |
|---|---|---|---|
| Unknown | $390,000 | -- | |
| Merritt Theodore B | $135,000 | -- | |
| Hafemann Charles R | -- | -- |
Source: Public Records
Mortgage History
| Date | Status | Borrower | Loan Amount |
|---|---|---|---|
| Open | Hafemann Charles R | $312,000 | |
| Previous Owner | Hafemann Charles R | $76,000 |
Source: Public Records
Tax History Compared to Growth
Tax History
| Year | Tax Paid | Tax Assessment Tax Assessment Total Assessment is a certain percentage of the fair market value that is determined by local assessors to be the total taxable value of land and additions on the property. | Land | Improvement |
|---|---|---|---|---|
| 2024 | $8,530 | $536,500 | $207,400 | $329,100 |
| 2023 | $8,238 | $451,900 | $165,900 | $286,000 |
| 2022 | $8,166 | $451,900 | $165,900 | $286,000 |
| 2021 | $7,725 | $332,700 | $117,000 | $215,700 |
| 2020 | $7,518 | $332,500 | $117,000 | $215,500 |
| 2019 | $7,235 | $332,500 | $117,000 | $215,500 |
| 2018 | $7,052 | $332,500 | $117,000 | $215,500 |
| 2017 | $6,863 | $266,100 | $96,300 | $169,800 |
| 2016 | $6,671 | $266,100 | $96,300 | $169,800 |
| 2015 | $6,527 | $266,100 | $96,300 | $169,800 |
| 2014 | $6,400 | $266,100 | $96,300 | $169,800 |
Source: Public Records
Map
Nearby Homes