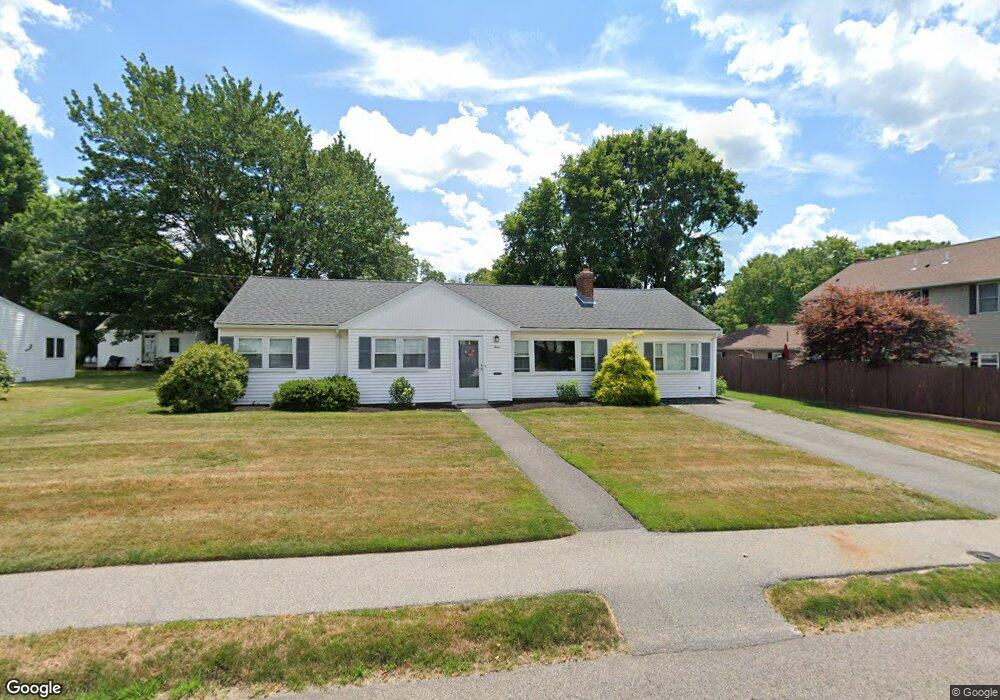
3 Flynn St Natick, MA 01760
Estimated Value: $806,000 - $928,000
3
Beds
1
Bath
1,378
Sq Ft
$632/Sq Ft
Est. Value
About This Home
This home is located at 3 Flynn St, Natick, MA 01760 and is currently estimated at $870,304, approximately $631 per square foot. 3 Flynn St is a home located in Middlesex County with nearby schools including Natick High School, Bennett-Hemenway (Ben-Hem) Elementary School, and Wilson Middle School.
Ownership History
Date
Name
Owned For
Owner Type
Purchase Details
Closed on
Mar 6, 2013
Sold by
Nichols Laura C and Nichols Jake P
Bought by
Nichols Laura C
Current Estimated Value
Purchase Details
Closed on
Feb 28, 2003
Sold by
Ferber Beverly L
Bought by
Nichols Jake P and Nichols Laura C
Home Financials for this Owner
Home Financials are based on the most recent Mortgage that was taken out on this home.
Original Mortgage
$287,910
Interest Rate
5.98%
Mortgage Type
Purchase Money Mortgage
Create a Home Valuation Report for This Property
The Home Valuation Report is an in-depth analysis detailing your home's value as well as a comparison with similar homes in the area
Home Values in the Area
Average Home Value in this Area
Purchase History
| Date | Buyer | Sale Price | Title Company |
|---|---|---|---|
| Nichols Laura C | -- | -- | |
| Nichols Jake P | $319,900 | -- |
Source: Public Records
Mortgage History
| Date | Status | Borrower | Loan Amount |
|---|---|---|---|
| Previous Owner | Nichols Jake P | $287,910 |
Source: Public Records
Tax History Compared to Growth
Tax History
| Year | Tax Paid | Tax Assessment Tax Assessment Total Assessment is a certain percentage of the fair market value that is determined by local assessors to be the total taxable value of land and additions on the property. | Land | Improvement |
|---|---|---|---|---|
| 2025 | $7,263 | $607,300 | $450,200 | $157,100 |
| 2024 | $7,074 | $577,000 | $425,200 | $151,800 |
| 2023 | $6,881 | $544,400 | $400,100 | $144,300 |
| 2022 | $6,695 | $501,900 | $365,100 | $136,800 |
| 2021 | $6,443 | $473,400 | $345,100 | $128,300 |
| 2020 | $6,239 | $458,400 | $330,100 | $128,300 |
| 2019 | $5,826 | $458,400 | $330,100 | $128,300 |
| 2018 | $6,075 | $393,500 | $300,100 | $93,400 |
| 2017 | $4,802 | $393,500 | $300,100 | $93,400 |
| 2016 | $4,626 | $340,900 | $250,100 | $90,800 |
| 2015 | $4,595 | $332,500 | $250,100 | $82,400 |
Source: Public Records
Map
Nearby Homes