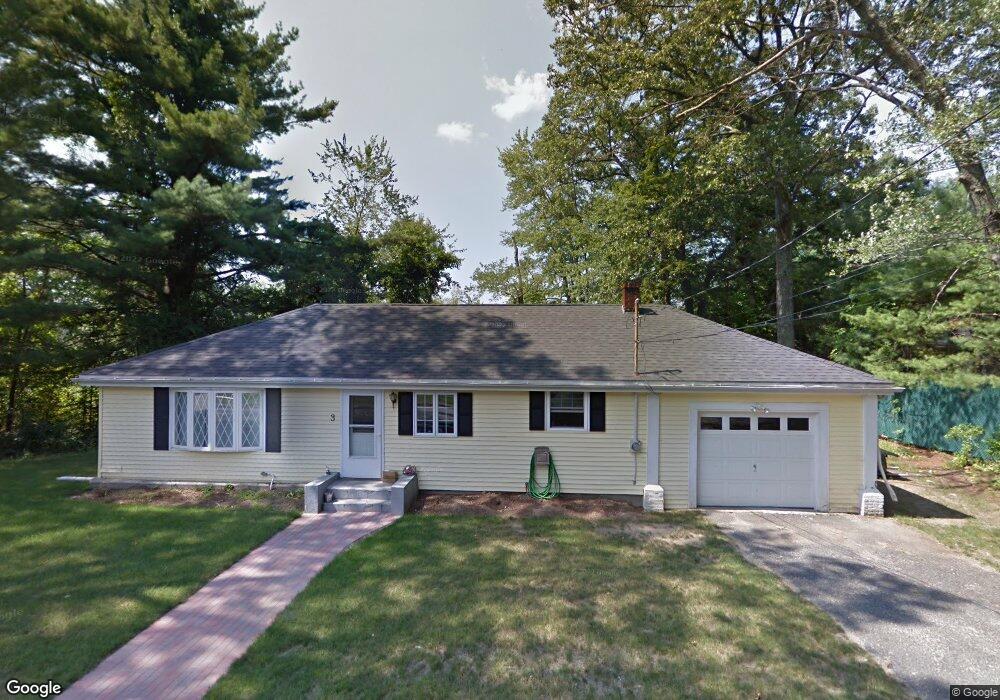
3 Old Colonial Rd Northborough, MA 01532
Estimated Value: $448,000 - $498,212
2
Beds
1
Bath
1,032
Sq Ft
$456/Sq Ft
Est. Value
About This Home
This home is located at 3 Old Colonial Rd, Northborough, MA 01532 and is currently estimated at $470,803, approximately $456 per square foot. 3 Old Colonial Rd is a home located in Worcester County with nearby schools including Lincoln Street Elementary School, Robert E. Melican Middle School, and Algonquin Regional High School.
Ownership History
Date
Name
Owned For
Owner Type
Purchase Details
Closed on
Sep 7, 2007
Sold by
3 Old Colonial Ft and Paquette S
Bought by
Fahey Shannon L and Rooney Steven P
Current Estimated Value
Home Financials for this Owner
Home Financials are based on the most recent Mortgage that was taken out on this home.
Original Mortgage
$234,650
Outstanding Balance
$149,854
Interest Rate
6.74%
Mortgage Type
Purchase Money Mortgage
Estimated Equity
$320,949
Purchase Details
Closed on
Oct 3, 2005
Sold by
Haire Roy L
Bought by
3 Old Colonial Ft and Paquette S
Home Financials for this Owner
Home Financials are based on the most recent Mortgage that was taken out on this home.
Original Mortgage
$80,000
Interest Rate
5.84%
Mortgage Type
Purchase Money Mortgage
Create a Home Valuation Report for This Property
The Home Valuation Report is an in-depth analysis detailing your home's value as well as a comparison with similar homes in the area
Home Values in the Area
Average Home Value in this Area
Purchase History
| Date | Buyer | Sale Price | Title Company |
|---|---|---|---|
| Fahey Shannon L | $247,000 | -- | |
| 3 Old Colonial Ft | $175,000 | -- |
Source: Public Records
Mortgage History
| Date | Status | Borrower | Loan Amount |
|---|---|---|---|
| Open | Fahey Shannon L | $234,650 | |
| Previous Owner | 3 Old Colonial Ft | $80,000 |
Source: Public Records
Tax History Compared to Growth
Tax History
| Year | Tax Paid | Tax Assessment Tax Assessment Total Assessment is a certain percentage of the fair market value that is determined by local assessors to be the total taxable value of land and additions on the property. | Land | Improvement |
|---|---|---|---|---|
| 2025 | $6,149 | $431,500 | $234,100 | $197,400 |
| 2024 | $5,361 | $375,400 | $189,500 | $185,900 |
| 2023 | $5,432 | $367,300 | $178,700 | $188,600 |
| 2022 | $5,331 | $323,300 | $170,200 | $153,100 |
| 2021 | $5,097 | $297,700 | $154,600 | $143,100 |
| 2020 | $5,115 | $296,500 | $154,600 | $141,900 |
| 2019 | $4,929 | $287,400 | $154,600 | $132,800 |
| 2018 | $4,671 | $268,600 | $151,300 | $117,300 |
| 2017 | $4,605 | $264,800 | $151,300 | $113,500 |
| 2016 | $4,456 | $259,500 | $148,000 | $111,500 |
| 2015 | $4,149 | $248,000 | $155,800 | $92,200 |
| 2014 | $4,006 | $241,500 | $155,800 | $85,700 |
Source: Public Records
Map
Nearby Homes
- 139 Davis St
- 1 Hamilton Rd
- 22 Hitching Post Ln
- 19 Crestwood Dr Unit 19
- 105 Lincoln St
- 198 South St
- 185-187 South St
- 11 Hillside Rd
- 223 South St
- 132 W Main St
- 89 W Main St
- 12 Saddle Hill Dr
- 90 W Main St
- 39 Pleasant St Unit B19
- 39 Pleasant St Unit C5
- 59 Indian Meadow Dr
- 243 Spring St
- 81 West St
- 349 Brigham St
- 26 High St