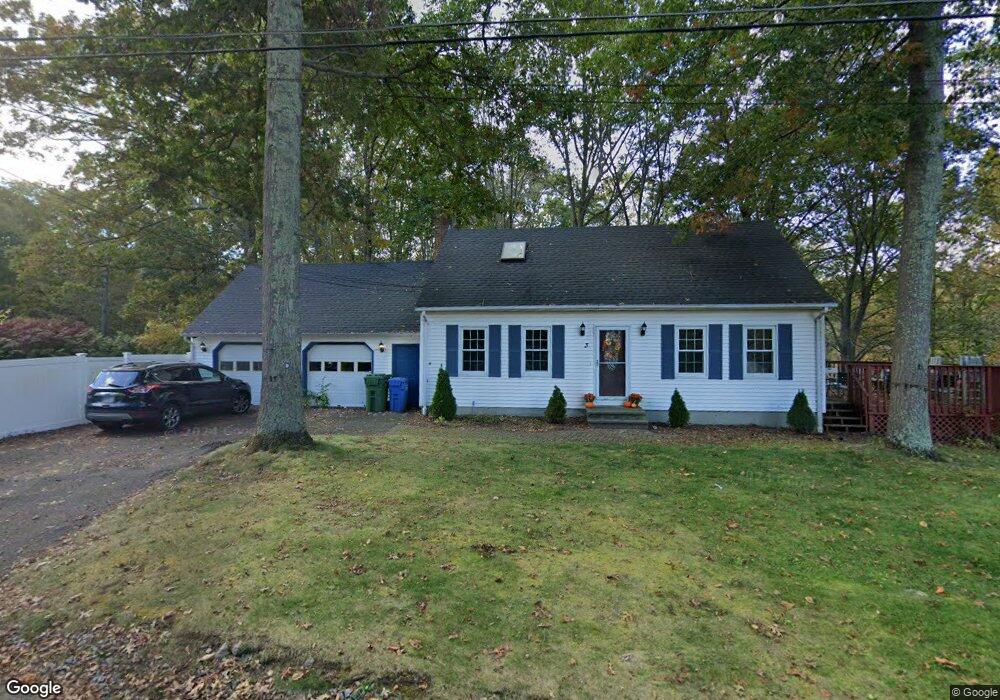
3 West Dr East Hampton, CT 06424
Estimated Value: $381,000 - $451,000
3
Beds
2
Baths
1,512
Sq Ft
$278/Sq Ft
Est. Value
About This Home
This home is located at 3 West Dr, East Hampton, CT 06424 and is currently estimated at $419,963, approximately $277 per square foot. 3 West Dr is a home located in Middlesex County with nearby schools including Memorial School, Center Elementary School, and East Hampton Middle School.
Ownership History
Date
Name
Owned For
Owner Type
Purchase Details
Closed on
Mar 27, 2020
Sold by
Birchall Andrew and Graham Alison
Bought by
Chapman Kelly A
Current Estimated Value
Home Financials for this Owner
Home Financials are based on the most recent Mortgage that was taken out on this home.
Original Mortgage
$251,010
Outstanding Balance
$222,364
Interest Rate
3.4%
Mortgage Type
Purchase Money Mortgage
Estimated Equity
$197,599
Purchase Details
Closed on
Jan 23, 2007
Sold by
Wilson Joshua H and Wilson Emily H
Bought by
Birchall Andrew and Graham Alison
Purchase Details
Closed on
Aug 1, 2002
Sold by
Kolleth Marilyn I
Bought by
Wilson Joshua H and Wilson Emily H
Purchase Details
Closed on
Jun 30, 1999
Sold by
Hutchinson Diane and Hutchinson Jon W
Bought by
Kolleth Marilyn I
Create a Home Valuation Report for This Property
The Home Valuation Report is an in-depth analysis detailing your home's value as well as a comparison with similar homes in the area
Home Values in the Area
Average Home Value in this Area
Purchase History
| Date | Buyer | Sale Price | Title Company |
|---|---|---|---|
| Chapman Kelly A | $248,500 | None Available | |
| Birchall Andrew | $269,900 | -- | |
| Birchall Andrew | $269,900 | -- | |
| Wilson Joshua H | $197,000 | -- | |
| Wilson Joshua H | $197,000 | -- | |
| Kolleth Marilyn I | $153,000 | -- | |
| Kolleth Marilyn I | $153,000 | -- |
Source: Public Records
Mortgage History
| Date | Status | Borrower | Loan Amount |
|---|---|---|---|
| Open | Chapman Kelly A | $251,010 | |
| Closed | Chapman Kelly A | $251,010 | |
| Previous Owner | Kolleth Marilyn I | $231,125 |
Source: Public Records
Tax History Compared to Growth
Tax History
| Year | Tax Paid | Tax Assessment Tax Assessment Total Assessment is a certain percentage of the fair market value that is determined by local assessors to be the total taxable value of land and additions on the property. | Land | Improvement |
|---|---|---|---|---|
| 2025 | $6,607 | $166,370 | $54,120 | $112,250 |
| 2024 | $6,329 | $166,370 | $54,120 | $112,250 |
| 2023 | $5,999 | $166,370 | $54,120 | $112,250 |
| 2022 | $5,766 | $166,370 | $54,120 | $112,250 |
| 2021 | $5,745 | $166,370 | $54,120 | $112,250 |
| 2020 | $4,927 | $148,670 | $37,280 | $111,390 |
| 2019 | $5,308 | $160,160 | $42,090 | $118,070 |
| 2018 | $5,016 | $160,160 | $42,090 | $118,070 |
| 2017 | $5,016 | $160,160 | $42,090 | $118,070 |
| 2016 | $4,715 | $160,160 | $42,090 | $118,070 |
| 2015 | $5,620 | $202,310 | $49,520 | $152,790 |
| 2014 | $4,890 | $202,310 | $49,520 | $152,790 |
Source: Public Records
Map
Nearby Homes