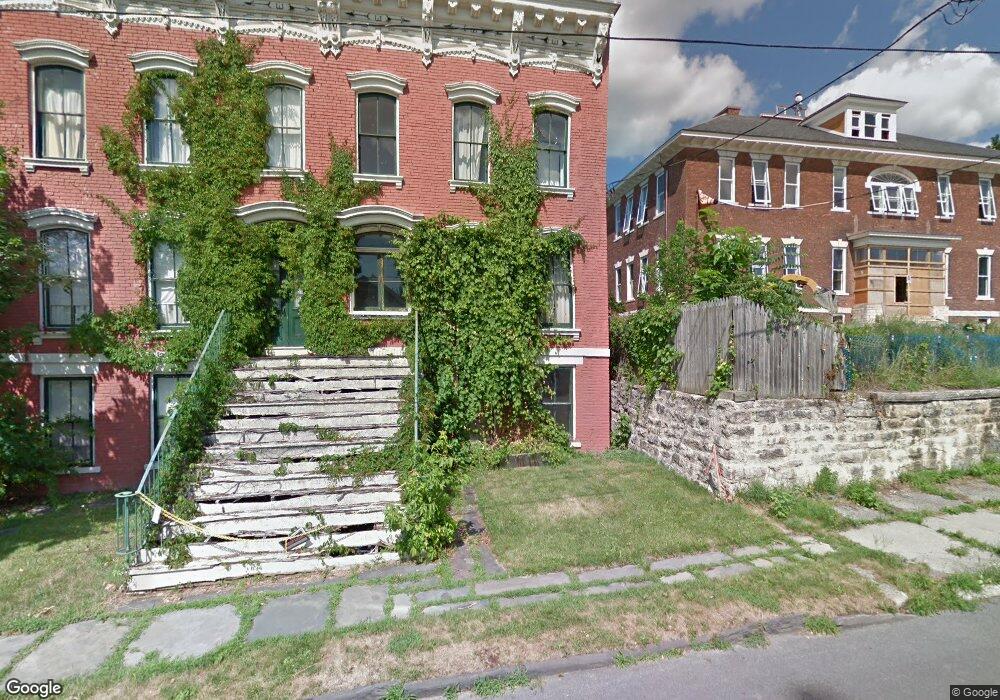
30 Allen St Hudson, NY 12534
Estimated Value: $1,000,496 - $1,095,000
3
Beds
2
Baths
2,500
Sq Ft
$415/Sq Ft
Est. Value
About This Home
This home is located at 30 Allen St, Hudson, NY 12534 and is currently estimated at $1,036,624, approximately $414 per square foot. 30 Allen St is a home located in Columbia County with nearby schools including Montgomery C. Smith Elementary School and Hudson Senior High School.
Ownership History
Date
Name
Owned For
Owner Type
Purchase Details
Closed on
Aug 19, 2024
Sold by
Hudson Collective Rlt Llc
Bought by
Cornwell Steven and Sinclair Jane
Current Estimated Value
Home Financials for this Owner
Home Financials are based on the most recent Mortgage that was taken out on this home.
Original Mortgage
$807,500
Outstanding Balance
$798,186
Interest Rate
6.77%
Mortgage Type
Purchase Money Mortgage
Estimated Equity
$238,438
Create a Home Valuation Report for This Property
The Home Valuation Report is an in-depth analysis detailing your home's value as well as a comparison with similar homes in the area
Home Values in the Area
Average Home Value in this Area
Purchase History
| Date | Buyer | Sale Price | Title Company |
|---|---|---|---|
| Cornwell Steven | $950,000 | First American Title | |
| Cornwell Steven | $950,000 | First American Title |
Source: Public Records
Mortgage History
| Date | Status | Borrower | Loan Amount |
|---|---|---|---|
| Open | Cornwell Steven | $807,500 | |
| Closed | Cornwell Steven | $807,500 |
Source: Public Records
Tax History Compared to Growth
Tax History
| Year | Tax Paid | Tax Assessment Tax Assessment Total Assessment is a certain percentage of the fair market value that is determined by local assessors to be the total taxable value of land and additions on the property. | Land | Improvement |
|---|---|---|---|---|
| 2024 | $13,653 | $639,000 | $21,000 | $618,000 |
| 2023 | $8,853 | $420,000 | $21,000 | $399,000 |
| 2022 | $8,144 | $420,000 | $21,000 | $399,000 |
| 2021 | $7,315 | $420,000 | $21,000 | $399,000 |
| 2020 | $8,042 | $420,000 | $21,000 | $399,000 |
| 2019 | $3,824 | $550,000 | $21,000 | $529,000 |
| 2018 | $3,824 | $190,000 | $21,000 | $169,000 |
| 2017 | $3,521 | $190,000 | $21,000 | $169,000 |
| 2016 | $3,375 | $190,000 | $21,000 | $169,000 |
| 2015 | -- | $131,000 | $21,000 | $110,000 |
| 2014 | -- | $131,000 | $21,000 | $110,000 |
Source: Public Records
Map
Nearby Homes