C
Seller's Agent in 2016
Clay Group
Keller Williams Realty
lot
Last Agent to Sell the Property
Clay Group
Keller Williams Realty Listed on: 06/29/2015
Last Buyer's Agent
Clay Group
Keller Williams Realty Listed on: 06/29/2015
Property Type
Est. Annual Taxes
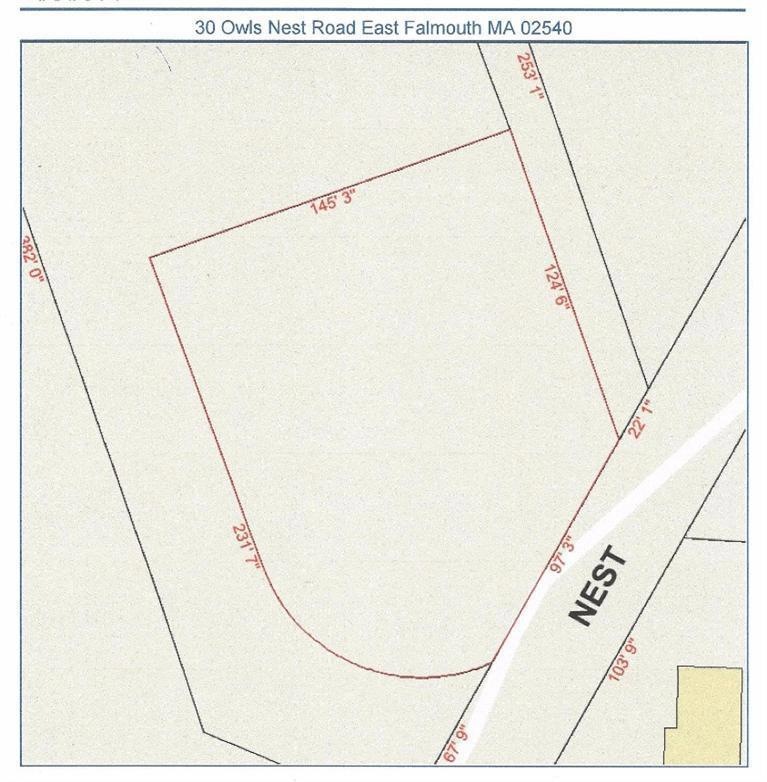
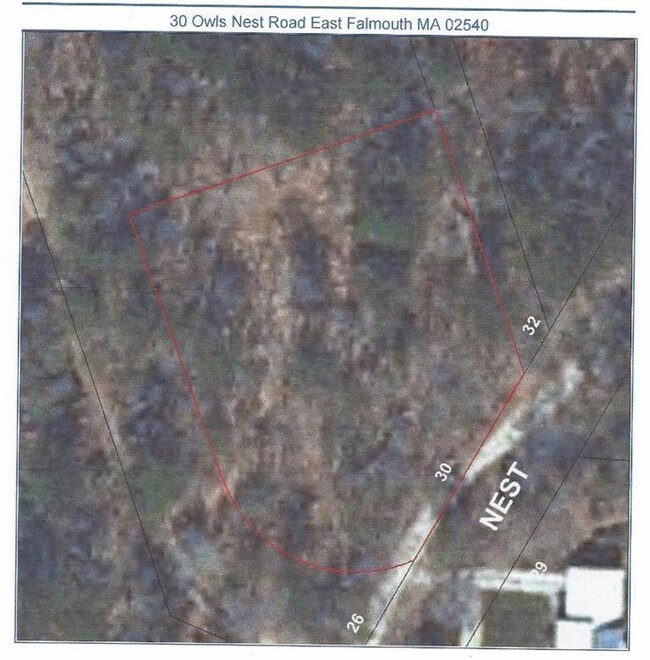
Lot Details
Location
Utilities
Listing and Financial Details
Overview
Recreation
| Date | Status | Loan Amount | Loan Type |
|---|---|---|---|
| Closed | $300,000 | New Conventional |
| Date | Event | Price | Change | Sq Ft Price |
|---|---|---|---|---|
| 08/19/2016 08/19/16 | Sold | $399,900 | 0.0% | $286 / Sq Ft |
| 05/18/2016 05/18/16 | Pending | -- | -- | -- |
| 12/01/2015 12/01/15 | For Sale | $399,900 | +320.9% | $286 / Sq Ft |
| 10/23/2015 10/23/15 | Sold | $95,000 | -24.0% | $68 / Sq Ft |
| 09/30/2015 09/30/15 | Pending | -- | -- | -- |
| 06/29/2015 06/29/15 | For Sale | $125,000 | -- | $89 / Sq Ft |
| Year | Tax Paid | Tax Assessment Tax Assessment Total Assessment is a certain percentage of the fair market value that is determined by local assessors to be the total taxable value of land and additions on the property. | Land | Improvement |
|---|---|---|---|---|
| 2024 | $3,981 | $633,900 | $153,000 | $480,900 |
| 2023 | $3,924 | $567,100 | $153,000 | $414,100 |
| 2022 | $3,736 | $464,100 | $115,300 | $348,800 |
| 2021 | $3,621 | $426,000 | $110,300 | $315,700 |
| 2020 | $3,573 | $416,000 | $100,300 | $315,700 |
| 2019 | $3,428 | $400,500 | $100,300 | $300,200 |
| 2018 | $3,221 | $374,500 | $100,300 | $274,200 |
| 2017 | $2,284 | $267,800 | $100,300 | $167,500 |
| 2016 | $840 | $100,300 | $100,300 | $0 |
| 2015 | $821 | $100,300 | $100,300 | $0 |
| 2014 | $861 | $105,600 | $105,600 | $0 |
C
Seller's Agent in 2016
Clay Group
Keller Williams Realty
Source: Cape Cod & Islands Association of REALTORS®
MLS Number: 21506204
APN: FALM-000027-000005-000007E-000000-D
Disclaimer: Certain information contained herein is derived from information provided by parties other than Homes.com. All information provided is deemed reliable, but is not guaranteed to be accurate and should be independently verified.
![]() All data relating to real estate for sale on this page comes from the Broker Reciprocity (BR) of the Cape Cod & Islands Multiple Listing Service, Inc. Detailed information about real estate listings held by brokerage firms other than CC&I Assoc. of REALTORS®, Inc. includes the name of the listing company. Neither the listing company nor CC&I Assoc. of REALTORS®, Inc. shall be responsible for any typographical errors, misinformation, misprints and shall be held totally harmless. The Broker providing this data believes it to be correct, but advises interested parties to confirm any item before relying on it in a purchase decision. All properties are subject to prior sale, changes, or withdrawal. Copyright 2025 © Cape Cod & Islands Multiple Listing Service, Inc. All rights reserved.
All data relating to real estate for sale on this page comes from the Broker Reciprocity (BR) of the Cape Cod & Islands Multiple Listing Service, Inc. Detailed information about real estate listings held by brokerage firms other than CC&I Assoc. of REALTORS®, Inc. includes the name of the listing company. Neither the listing company nor CC&I Assoc. of REALTORS®, Inc. shall be responsible for any typographical errors, misinformation, misprints and shall be held totally harmless. The Broker providing this data believes it to be correct, but advises interested parties to confirm any item before relying on it in a purchase decision. All properties are subject to prior sale, changes, or withdrawal. Copyright 2025 © Cape Cod & Islands Multiple Listing Service, Inc. All rights reserved.