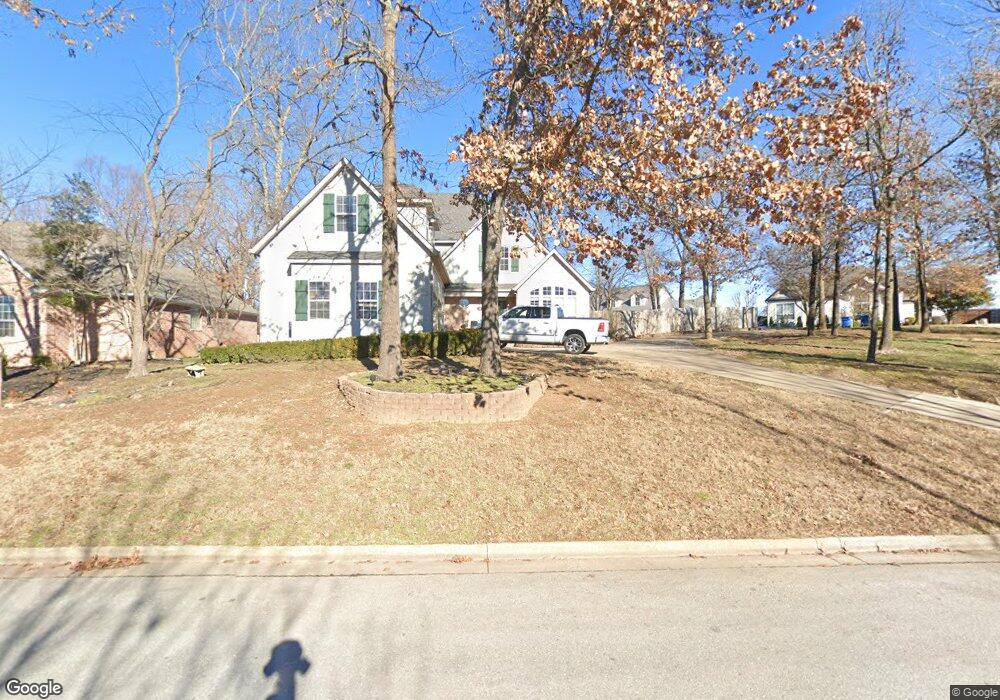
300 Genesis Dr Bentonville, AR 72712
Estimated Value: $722,832 - $828,000
3
Beds
3
Baths
2,838
Sq Ft
$275/Sq Ft
Est. Value
About This Home
This home is located at 300 Genesis Dr, Bentonville, AR 72712 and is currently estimated at $780,958, approximately $275 per square foot. 300 Genesis Dr is a home located in Benton County with nearby schools including Sugar Creek Elementary School, Lincoln Junior High School, and Old High Middle School.
Ownership History
Date
Name
Owned For
Owner Type
Purchase Details
Closed on
May 10, 2017
Sold by
Shepherd Debra L and Shepherd Leanne
Bought by
Rodriguez Juan C and Shepherd Lwanne
Current Estimated Value
Purchase Details
Closed on
Mar 27, 2008
Sold by
White Eric C and White Tamara M
Bought by
Shepherd Debra L and Shepherd Michael K
Home Financials for this Owner
Home Financials are based on the most recent Mortgage that was taken out on this home.
Original Mortgage
$286,200
Interest Rate
5.89%
Mortgage Type
Purchase Money Mortgage
Purchase Details
Closed on
May 13, 2002
Bought by
White
Purchase Details
Closed on
Nov 18, 1998
Bought by
Madrazo
Purchase Details
Closed on
Dec 1, 1997
Bought by
Black
Purchase Details
Closed on
Jun 13, 1994
Bought by
Hidden Spgs Ent
Purchase Details
Closed on
May 3, 1994
Bought by
Na
Create a Home Valuation Report for This Property
The Home Valuation Report is an in-depth analysis detailing your home's value as well as a comparison with similar homes in the area
Home Values in the Area
Average Home Value in this Area
Purchase History
| Date | Buyer | Sale Price | Title Company |
|---|---|---|---|
| Rodriguez Juan C | -- | None Available | |
| Shepherd Debra L | $318,000 | None Available | |
| White | $275,000 | -- | |
| Madrazo | $270,000 | -- | |
| Black | $28,000 | -- | |
| Hidden Spgs Ent | -- | -- | |
| Na | -- | -- |
Source: Public Records
Mortgage History
| Date | Status | Borrower | Loan Amount |
|---|---|---|---|
| Previous Owner | Shepherd Debra L | $286,200 |
Source: Public Records
Tax History Compared to Growth
Tax History
| Year | Tax Paid | Tax Assessment Tax Assessment Total Assessment is a certain percentage of the fair market value that is determined by local assessors to be the total taxable value of land and additions on the property. | Land | Improvement |
|---|---|---|---|---|
| 2025 | $5,323 | $111,349 | $30,000 | $81,349 |
| 2024 | $4,901 | $111,349 | $30,000 | $81,349 |
| 2023 | $4,456 | $72,100 | $8,600 | $63,500 |
| 2022 | $4,391 | $72,100 | $8,600 | $63,500 |
| 2021 | $4,012 | $72,100 | $8,600 | $63,500 |
| 2020 | $3,683 | $57,810 | $7,400 | $50,410 |
| 2019 | $3,683 | $57,810 | $7,400 | $50,410 |
| 2018 | $3,683 | $57,810 | $7,400 | $50,410 |
| 2017 | $3,008 | $57,810 | $7,400 | $50,410 |
| 2016 | $3,008 | $57,810 | $7,400 | $50,410 |
| 2015 | $3,203 | $51,830 | $8,000 | $43,830 |
| 2014 | $2,853 | $51,830 | $8,000 | $43,830 |
Source: Public Records
Map
Nearby Homes
- 2017 NW Desoto Dr
- 0 NW Turner Dr
- 203 NW Lasalle Dr
- 14 Valley View Cir
- 802 NW 20th St
- 1 Greenridge Ln
- Lot 3 NW Hidden Cove
- 2311 NW Harvard Walk
- 1016 NW A St
- 1022 NW A St
- 1703 Kimberly Place
- 1606 Kimberly Place
- 1605 Kimberly Place
- 703 NE Heights Ln
- 9 Hanna Dr
- 701 NE Heights Ln
- 12502 Slaughter Pen Rd
- 833 NE Heights Ln
- 1259 NW A St
- 837 NE Heights Ln
- 302 Genesis Dr
- 2102 NW Turner Dr
- 2100 NW Turner Dr
- 301 Genesis Dr
- 301 Genesis Dr Unit ID1221815P
- 303 Genesis Dr
- 303 Genesis Dr Unit ID1227150P
- 2104 NW Turner Dr
- 305 Genesis Dr
- 304 Genesis Dr
- 2106 NW Turner Dr
- 205 Genesis Dr
- 2103 NW A St
- 307 Genesis Dr
- 200 Genesis Dr
- 2105 NW A St
- 203 Genesis Dr
- 301 Laurinda Dr
- 201 Laurinda Dr
- 2020 NW Desoto Dr