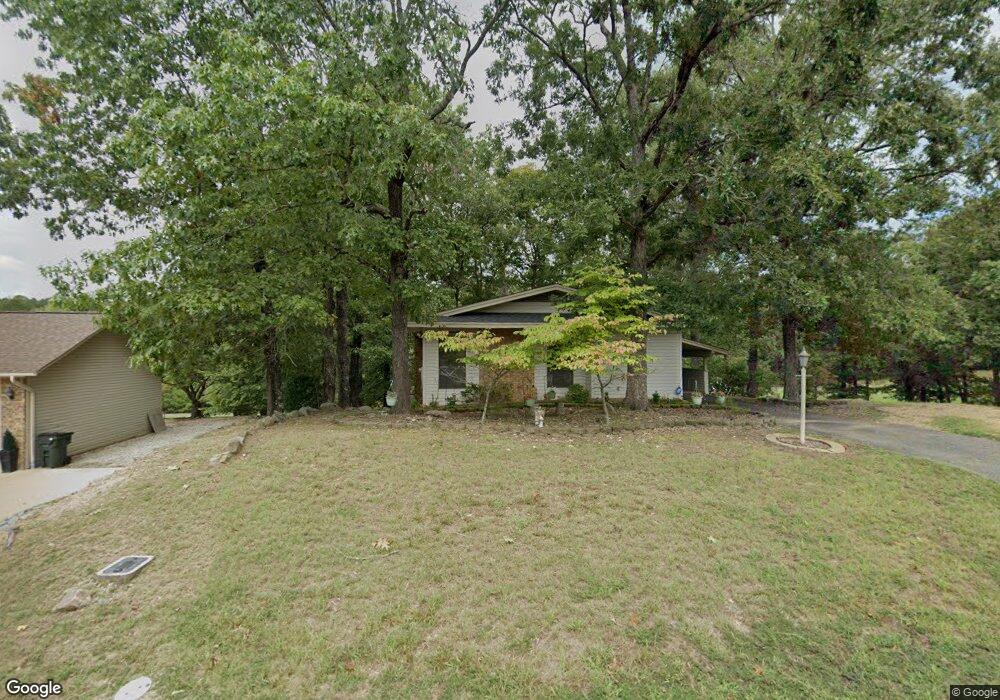
300 Pebble Beach Dr Hot Springs National Park, AR 71913
Estimated Value: $233,332 - $324,000
3
Beds
3
Baths
1,974
Sq Ft
$138/Sq Ft
Est. Value
About This Home
This home is located at 300 Pebble Beach Dr, Hot Springs National Park, AR 71913 and is currently estimated at $271,583, approximately $137 per square foot. 300 Pebble Beach Dr is a home located in Garland County with nearby schools including Lakeside Primary School, Lakeside Intermediate School, and Lakeside Junior High School.
Ownership History
Date
Name
Owned For
Owner Type
Purchase Details
Closed on
Sep 17, 2025
Sold by
Larner William Heath
Bought by
Larner Stephanie
Current Estimated Value
Purchase Details
Closed on
Sep 26, 2011
Sold by
Brady Billy Bob and Brady Nita Joyce
Bought by
Larner William H and Larner Stephanie D
Home Financials for this Owner
Home Financials are based on the most recent Mortgage that was taken out on this home.
Original Mortgage
$121,831
Interest Rate
4.4%
Mortgage Type
FHA
Purchase Details
Closed on
Dec 28, 2009
Sold by
Plyler Jason Mark and Plyler Amanda Michelle
Bought by
Brady Billy Bob and Brady Nita Joyce
Purchase Details
Closed on
Jun 21, 2005
Sold by
Plyler Jams Larry and Plyler Sarah Ann
Bought by
Plyler Jason Mark and Plyler Amanda Michelle
Purchase Details
Closed on
Dec 21, 1998
Sold by
Not Provided
Bought by
Plyler J Larry and Plyler Sarah A
Create a Home Valuation Report for This Property
The Home Valuation Report is an in-depth analysis detailing your home's value as well as a comparison with similar homes in the area
Home Values in the Area
Average Home Value in this Area
Purchase History
| Date | Buyer | Sale Price | Title Company |
|---|---|---|---|
| Larner Stephanie | -- | None Listed On Document | |
| Larner Stephanie | -- | None Listed On Document | |
| Larner William H | $115,921 | Lenders Title Company | |
| Brady Billy Bob | $113,000 | Lenders Title Company | |
| Plyler Jason Mark | -- | None Available | |
| Plyler J Larry | $85,000 | -- |
Source: Public Records
Mortgage History
| Date | Status | Borrower | Loan Amount |
|---|---|---|---|
| Previous Owner | Larner William H | $121,831 | |
| Closed | Plyler Jason Mark | $0 |
Source: Public Records
Tax History Compared to Growth
Tax History
| Year | Tax Paid | Tax Assessment Tax Assessment Total Assessment is a certain percentage of the fair market value that is determined by local assessors to be the total taxable value of land and additions on the property. | Land | Improvement |
|---|---|---|---|---|
| 2025 | $510 | $29,810 | $4,500 | $25,310 |
| 2024 | $550 | $29,810 | $4,500 | $25,310 |
| 2023 | $579 | $29,810 | $4,500 | $25,310 |
| 2022 | $1,050 | $29,810 | $4,500 | $25,310 |
| 2021 | $1,007 | $20,330 | $2,400 | $17,930 |
| 2020 | $632 | $20,330 | $2,400 | $17,930 |
| 2019 | $546 | $20,330 | $2,400 | $17,930 |
| 2018 | $657 | $20,330 | $2,400 | $17,930 |
| 2017 | $490 | $20,330 | $2,400 | $17,930 |
| 2016 | $490 | $20,330 | $2,400 | $17,930 |
| 2015 | $490 | $20,330 | $2,400 | $17,930 |
| 2014 | $489 | $20,330 | $2,400 | $17,930 |
Source: Public Records
Map
Nearby Homes
- 309 Pebble Beach Dr
- 114 Cherry Hill Dr
- Lot 1678A Westchester Ct
- 1667A-1671A Westchester Ct
- 1672 Westchester Ct
- 173 Pebble Beach Place
- 160 Tam o Shanter Ct
- 0 Tam o Shanter Ct
- Plat 3 Pebble Beach
- 0 Pebble Beach Dr Unit 150416
- 100 Saint Andrews Dr
- Lot 1699A Oakmont Ct
- Plat 2 Pebble Beach
- LOt 1663 Pebble Beach Dr
- 216 Diamondhead Dr
- Pt 1476 & 1477 Saint Andrews Dr
- Pt 1476all 1477 Saint Andrews Dr
- 1432 Saint Andrews Dr Unit Diamondhead
- 1453 Saint Andrews Dr
- Lot 1461-1463 Saint Andrews Dr
- 304 Pebble Beach Dr
- 228 Pebble Beach Dr
- Lot 1663 Pebble Beach
- 303 Pebble Beach Dr
- 303 Pebble Beach Dr
- 229 Pebble Beach Dr
- 116 Cherry Hill Dr
- 308 Pebble Beach Dr
- 224 Pebble Beach Dr
- 114 Cherry Hill
- 222 Pebble Beach Dr
- Lots 1494-1495 Cherry Hill
- 102 Westchester Ct
- Lots 1194-1195 Cherry Hill Dr
- lot 1496 Cherry Hill Dr
- Lot 1497 Cherry Hill Dr
- 114 Tam O Shantor Ct
- lot 1480 St Andrews Dr
- 109 Saint Andrews Dr
- 217 Pebble Beach Dr