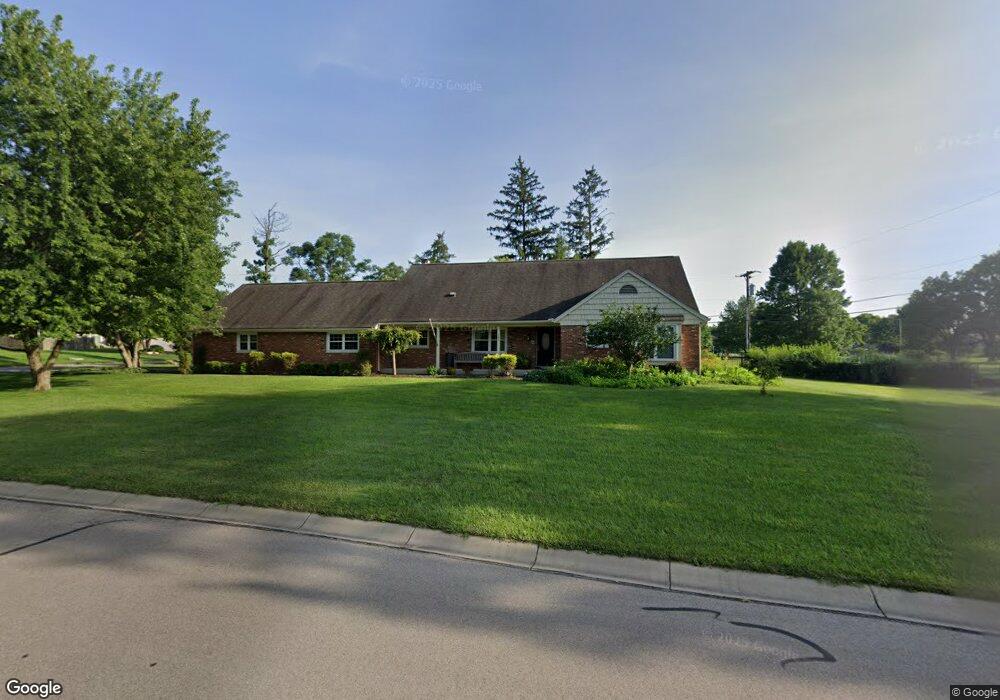
300 Southbrook Dr Dayton, OH 45459
Woodbourne-Hyde Park NeighborhoodEstimated Value: $431,813 - $518,000
4
Beds
3
Baths
3,428
Sq Ft
$141/Sq Ft
Est. Value
About This Home
This home is located at 300 Southbrook Dr, Dayton, OH 45459 and is currently estimated at $484,203, approximately $141 per square foot. 300 Southbrook Dr is a home located in Montgomery County with nearby schools including Primary Village North, John Hole Elementary, and Hadley E Watts Middle School.
Ownership History
Date
Name
Owned For
Owner Type
Purchase Details
Closed on
May 4, 2020
Sold by
Smith Matthew J and Smith Shannon R
Bought by
Stumpf Aaron N and Stumpf Jacee E
Current Estimated Value
Home Financials for this Owner
Home Financials are based on the most recent Mortgage that was taken out on this home.
Original Mortgage
$347,060
Outstanding Balance
$306,962
Interest Rate
3.2%
Mortgage Type
VA
Estimated Equity
$177,241
Purchase Details
Closed on
Jan 13, 2015
Sold by
Burdick John C and Burdick Janene J
Bought by
Smith Matthew J and Smith Shannon R
Home Financials for this Owner
Home Financials are based on the most recent Mortgage that was taken out on this home.
Original Mortgage
$261,155
Interest Rate
3.84%
Mortgage Type
Future Advance Clause Open End Mortgage
Purchase Details
Closed on
Sep 29, 2006
Sold by
Geyer Howard W and Geyer Eleanor T
Bought by
Burdick John C and Burdick Janene J
Home Financials for this Owner
Home Financials are based on the most recent Mortgage that was taken out on this home.
Original Mortgage
$234,000
Interest Rate
6.49%
Mortgage Type
Purchase Money Mortgage
Create a Home Valuation Report for This Property
The Home Valuation Report is an in-depth analysis detailing your home's value as well as a comparison with similar homes in the area
Home Values in the Area
Average Home Value in this Area
Purchase History
| Date | Buyer | Sale Price | Title Company |
|---|---|---|---|
| Stumpf Aaron N | $335,000 | Landmark Ttl Agcy South Inc | |
| Smith Matthew J | $274,900 | Home Services Title Llc | |
| Burdick John C | $292,500 | First American Title Ins Co |
Source: Public Records
Mortgage History
| Date | Status | Borrower | Loan Amount |
|---|---|---|---|
| Open | Stumpf Aaron N | $347,060 | |
| Previous Owner | Smith Matthew J | $261,155 | |
| Previous Owner | Burdick John C | $234,000 |
Source: Public Records
Tax History Compared to Growth
Tax History
| Year | Tax Paid | Tax Assessment Tax Assessment Total Assessment is a certain percentage of the fair market value that is determined by local assessors to be the total taxable value of land and additions on the property. | Land | Improvement |
|---|---|---|---|---|
| 2024 | $6,967 | $113,080 | $21,700 | $91,380 |
| 2023 | $6,967 | $113,080 | $21,700 | $91,380 |
| 2022 | $7,101 | $91,200 | $17,500 | $73,700 |
| 2021 | $7,120 | $91,200 | $17,500 | $73,700 |
| 2020 | $7,110 | $91,200 | $17,500 | $73,700 |
| 2019 | $6,555 | $75,110 | $17,500 | $57,610 |
| 2018 | $5,854 | $75,110 | $17,500 | $57,610 |
| 2017 | $5,792 | $75,110 | $17,500 | $57,610 |
| 2016 | $5,934 | $72,540 | $17,500 | $55,040 |
| 2015 | $5,838 | $72,540 | $17,500 | $55,040 |
| 2014 | $5,838 | $72,540 | $17,500 | $55,040 |
| 2012 | -- | $81,660 | $17,500 | $64,160 |
Source: Public Records
Map
Nearby Homes
- 6935 Paragon Rd
- 312 Trebor Ln
- 7006 Cedar Pines Ct
- 427 Meadowview Dr
- 36 Blackstone Dr
- 121 S Village Dr
- 119 Blackstone Dr
- 281 N Village Dr
- 24 Nicholson Ct Unit 10
- 6000 Cobbleskill Ct
- 152 Cheltenham Dr
- 40 Nicholson Ct Unit 4
- 187 Cheltenham Dr
- 85 Poinciana Dr
- 950 Olde Sterling Way
- 901 Olde Sterling Way
- 160 Ashford Dr
- 190 Winchcombe Dr
- 271 Maple Ave
- 6013 Gothic Place
- 308 Southbrook Dr
- 0 Paragon Rd
- 1 Paragon
- 0 Paragon Mills Ln
- 301 Southbrook Dr
- 6600 Green Park Dr
- 6608 Green Park Dr
- 307 Southbrook Dr
- 228 Southbrook Dr
- 231 Southbrook Dr
- 400 Southbrook Dr
- 131 Forestview Dr
- 6508 Rosa Linda Dr
- 6700 Green Park Dr
- 6515 Rosa Linda Dr
- 225 Southbrook Dr
- 220 Southbrook Dr
- 123 Forestview Dr
- 130 Forestview Dr
- 6500 Rosa Linda Dr