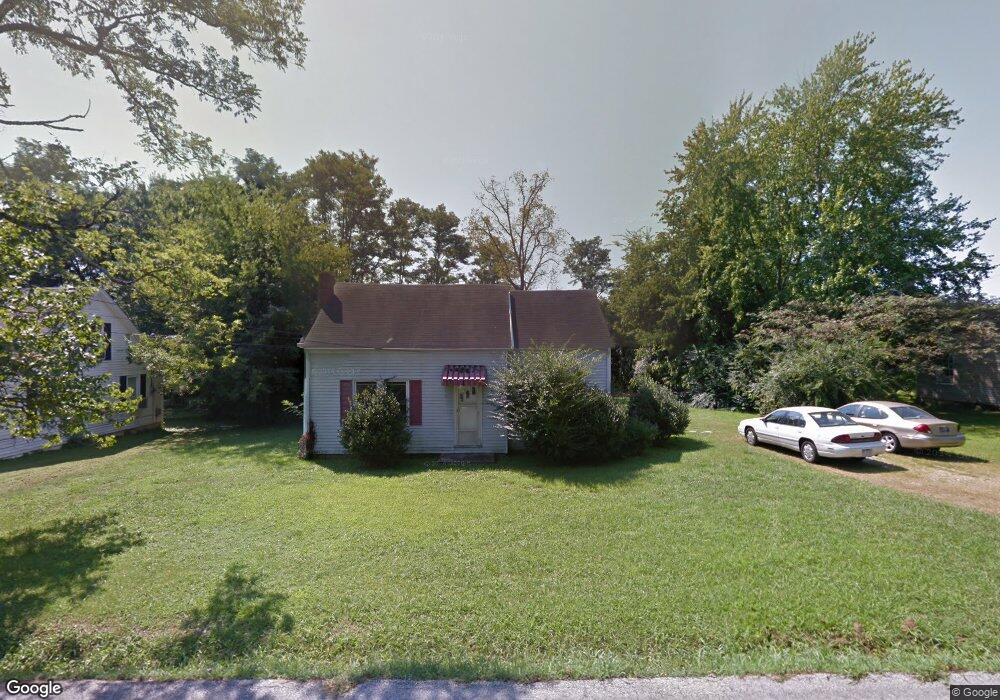
301 Meador Dr Lafayette, TN 37083
Estimated Value: $114,661 - $191,000
--
Bed
1
Bath
1,656
Sq Ft
$90/Sq Ft
Est. Value
About This Home
This home is located at 301 Meador Dr, Lafayette, TN 37083 and is currently estimated at $149,665, approximately $90 per square foot. 301 Meador Dr is a home located in Macon County with nearby schools including Macon Christian Academy.
Ownership History
Date
Name
Owned For
Owner Type
Purchase Details
Closed on
Jun 19, 2006
Sold by
Dana Buus
Bought by
Jubilee Investments Llc
Current Estimated Value
Purchase Details
Closed on
Aug 3, 2005
Bought by
Buus Dana and Buus Bonnie
Home Financials for this Owner
Home Financials are based on the most recent Mortgage that was taken out on this home.
Original Mortgage
$24,972
Interest Rate
5.57%
Mortgage Type
Cash
Purchase Details
Closed on
Feb 24, 1999
Sold by
Joe Eden
Bought by
Ronald Patterson
Purchase Details
Closed on
Mar 28, 1997
Sold by
Mark Shrum
Bought by
Eden and Kathy
Purchase Details
Closed on
Nov 1, 1994
Sold by
Froedge E M
Bought by
Mark Shrum
Purchase Details
Closed on
Dec 14, 1993
Bought by
Froedge Md E M
Purchase Details
Closed on
Sep 24, 1993
Bought by
Froedge Md Froedge E and Froedge Ruth
Purchase Details
Closed on
Jun 27, 1990
Bought by
Ty-Barr Inc
Purchase Details
Closed on
Feb 11, 1978
Bought by
Patterson Billy J and Patterson Emma
Create a Home Valuation Report for This Property
The Home Valuation Report is an in-depth analysis detailing your home's value as well as a comparison with similar homes in the area
Home Values in the Area
Average Home Value in this Area
Purchase History
| Date | Buyer | Sale Price | Title Company |
|---|---|---|---|
| Jubilee Investments Llc | $33,500 | -- | |
| Buus Dana | $31,200 | -- | |
| Ronald Patterson | $30,500 | -- | |
| Eden | $23,500 | -- | |
| Mark Shrum | $21,000 | -- | |
| Froedge Md E M | -- | -- | |
| Froedge Md Froedge E | -- | -- | |
| Ty-Barr Inc | -- | -- | |
| Patterson Billy J | -- | -- |
Source: Public Records
Mortgage History
| Date | Status | Borrower | Loan Amount |
|---|---|---|---|
| Previous Owner | Patterson Billy J | $24,972 |
Source: Public Records
Tax History Compared to Growth
Tax History
| Year | Tax Paid | Tax Assessment Tax Assessment Total Assessment is a certain percentage of the fair market value that is determined by local assessors to be the total taxable value of land and additions on the property. | Land | Improvement |
|---|---|---|---|---|
| 2024 | $350 | $22,025 | $4,500 | $17,525 |
| 2023 | $414 | $22,025 | $0 | $0 |
| 2022 | $373 | $11,825 | $3,000 | $8,825 |
| 2021 | $367 | $11,825 | $3,000 | $8,825 |
| 2020 | $367 | $11,825 | $3,000 | $8,825 |
| 2019 | $367 | $11,825 | $3,000 | $8,825 |
| 2018 | $339 | $11,825 | $3,000 | $8,825 |
| 2017 | $308 | $9,400 | $1,875 | $7,525 |
| 2016 | $297 | $9,400 | $1,875 | $7,525 |
| 2015 | $296 | $9,400 | $1,875 | $7,525 |
| 2014 | $297 | $9,441 | $0 | $0 |
Source: Public Records
Map
Nearby Homes
- 414 Meador Dr
- 5370 Galen Rd
- 309 Bratton Ave
- 306 Cassie Dr
- 130 Mazie Dr
- 907 Freeman St Unit D
- 914 Freeman St
- 108 Young Ave
- 1305 Scottsville Rd
- 0 Wooten Ave
- 1212 Hollis Ln
- 1216 Hollis Ln
- 304 Church St
- 1108 Flippin Dr
- 0 Short St Unit RTC2889648
- 899 Sneed Blvd
- 855 Sneed Blvd
- 500 Akersville Rd
- 1403 Flippin Dr
- 1009 Due West Cir