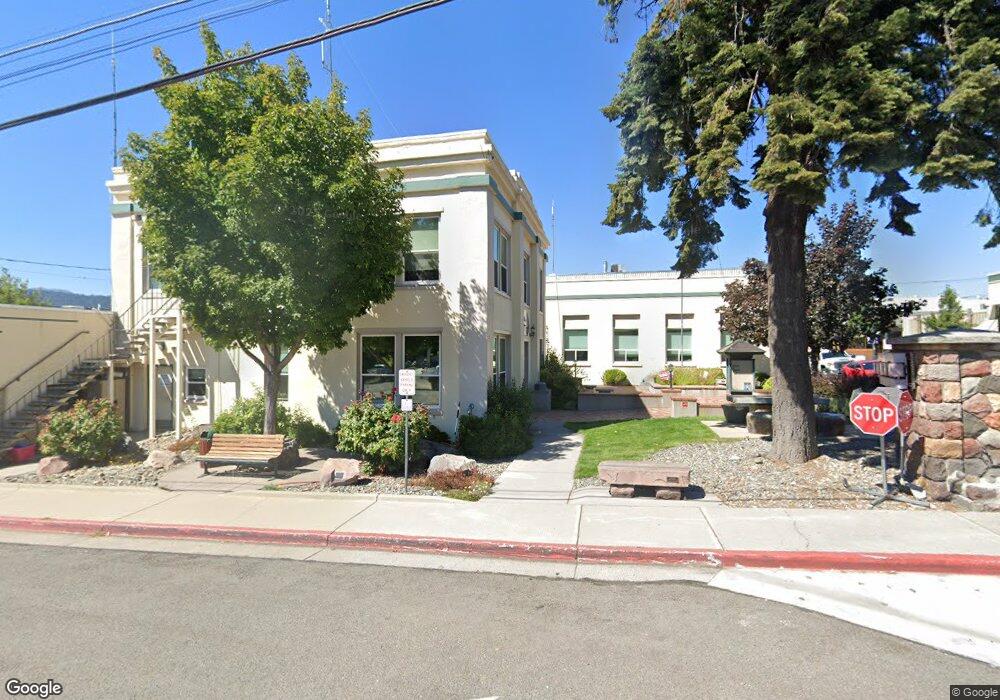
301 N Mount Shasta Blvd Mount Shasta, CA 96067
--
Bed
--
Bath
--
Sq Ft
6,360
Sq Ft Lot
About This Home
This home is located at 301 N Mount Shasta Blvd, Mount Shasta, CA 96067. 301 N Mount Shasta Blvd is a home located in Siskiyou County with nearby schools including Mt. Shasta Elementary School, Mt. Shasta High School, and Golden Eagle Charter School.
Ownership History
Date
Name
Owned For
Owner Type
Purchase Details
Closed on
Dec 28, 2017
Sold by
Chang Hua
Bought by
Fp Investments Llc
Purchase Details
Closed on
May 7, 2009
Sold by
Yang Min Ho and Kim Myung Hee
Bought by
Chang Hua
Purchase Details
Closed on
Apr 13, 2006
Sold by
Chang Hua Chiang and Chang Hau
Bought by
Yang Min Ho and Kim Myoung Hee
Home Financials for this Owner
Home Financials are based on the most recent Mortgage that was taken out on this home.
Original Mortgage
$152,000
Interest Rate
6.35%
Mortgage Type
Seller Take Back
Purchase Details
Closed on
Sep 9, 2004
Sold by
Shasta Siskiyou Transport
Bought by
Chang Hua
Home Financials for this Owner
Home Financials are based on the most recent Mortgage that was taken out on this home.
Original Mortgage
$360,000
Interest Rate
5.94%
Mortgage Type
Seller Take Back
Purchase Details
Closed on
Mar 4, 2004
Sold by
Taylor Geraldine G
Bought by
Shasta Siskiyou Transport
Create a Home Valuation Report for This Property
The Home Valuation Report is an in-depth analysis detailing your home's value as well as a comparison with similar homes in the area
Home Values in the Area
Average Home Value in this Area
Purchase History
| Date | Buyer | Sale Price | Title Company |
|---|---|---|---|
| Fp Investments Llc | $550,000 | Placer Title Co | |
| Chang Hua | -- | Mt Shasta Title | |
| Yang Min Ho | $243,500 | First American Title Co | |
| Chang Hua | $445,000 | Mount Shasta Title & Escrow | |
| Shasta Siskiyou Transport | $477,500 | Siskiyou County Title Co |
Source: Public Records
Mortgage History
| Date | Status | Borrower | Loan Amount |
|---|---|---|---|
| Previous Owner | Yang Min Ho | $152,000 | |
| Previous Owner | Chang Hua | $360,000 |
Source: Public Records
Tax History Compared to Growth
Tax History
| Year | Tax Paid | Tax Assessment Tax Assessment Total Assessment is a certain percentage of the fair market value that is determined by local assessors to be the total taxable value of land and additions on the property. | Land | Improvement |
|---|---|---|---|---|
| 2025 | $4,795 | $449,435 | $94,436 | $354,999 |
| 2023 | $4,795 | $431,985 | $90,770 | $341,215 |
| 2022 | $4,615 | $423,516 | $88,991 | $334,525 |
| 2021 | $4,537 | $415,213 | $87,247 | $327,966 |
| 2020 | $4,538 | $410,957 | $86,353 | $324,604 |
| 2019 | $4,455 | $402,900 | $84,660 | $318,240 |
| 2018 | $4,370 | $395,000 | $83,000 | $312,000 |
| 2017 | $731 | $66,571 | $66,571 | $0 |
| 2016 | $717 | $65,266 | $65,266 | $0 |
| 2015 | -- | $64,286 | $64,286 | $0 |
| 2014 | -- | $63,027 | $63,027 | $0 |
Source: Public Records
Map
Nearby Homes
- Parcel 1,2,3 Pine Field St
- 0 Alma St Apn #057-203-040
- 208 Mccloud Ave
- lot 7 Ream Ave
- 114 Smith St
- parcel 3 Deetz Rd
- 0 Berry St
- 109 N Washington Dr
- 506 Eiler Rd
- 322 E Jessie St
- 509 Mccloud Ave
- 619 Spring St
- Financing Miningclaim Ownership
- Financing Miningclaim Ownership
- 704 Marjorie St
- 206 E Hinckley St
- 809 Caroline Ave
- 00 Kenneth Marjorie
- 201 Terry Lynn Ave
- 1007 Mccloud Ave
- 219 N Mount Shasta Blvd
- 101 W Lake St
- 105 W Lake St
- 209 N Mount Shasta Blvd
- 224 N Mount Shasta Blvd
- 220 N Mount Shasta Blvd
- 110 Alpine St
- 108 Alpine St
- 230 N Mount Shasta Blvd
- 106 Alpine St
- 214 N Mount Shasta Blvd
- 117 W Lake St
- 204 Maple St
- 212 N Mount Shasta Blvd
- 320 N Mt Shasta Blvd
- 320 N Mt Shasta Blvd
- 320 N Mount Shasta Blvd
- 201 N Mount Shasta Blvd
- 201 N Mount Shasta Blvd Unit A
- 309 N Mount Shasta Blvd