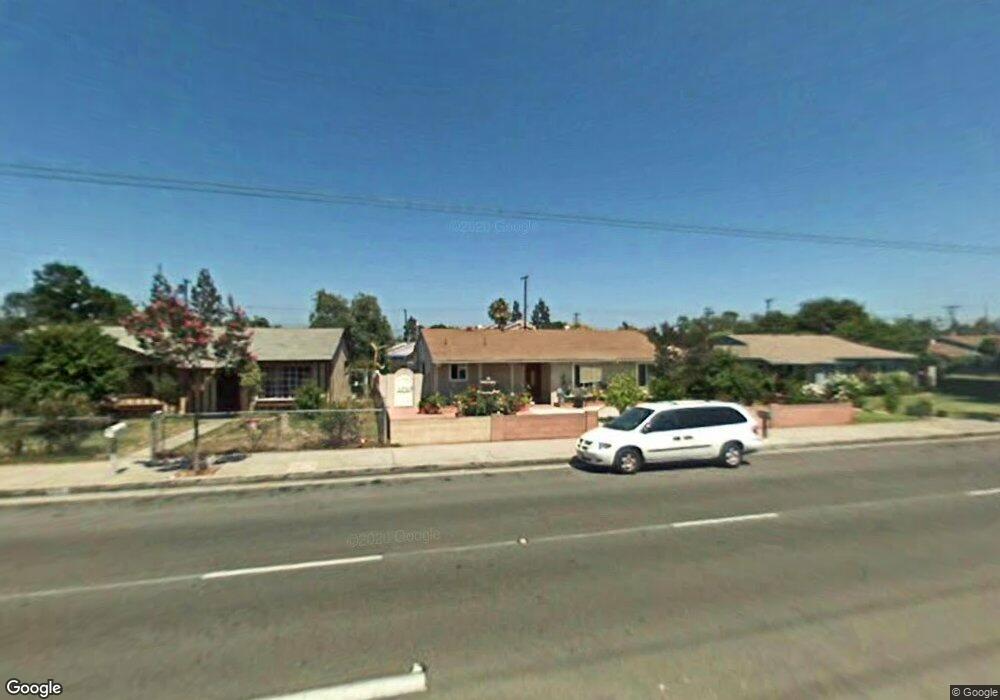
301 N Newhope St Santa Ana, CA 92703
Riverview West NeighborhoodEstimated Value: $826,000 - $1,063,000
3
Beds
2
Baths
1,151
Sq Ft
$805/Sq Ft
Est. Value
About This Home
This home is located at 301 N Newhope St, Santa Ana, CA 92703 and is currently estimated at $926,567, approximately $805 per square foot. 301 N Newhope St is a home located in Orange County with nearby schools including R. F. Hazard Elementary School, James Irvine Intermediate School, and Los Amigos High School.
Ownership History
Date
Name
Owned For
Owner Type
Purchase Details
Closed on
Mar 18, 2003
Sold by
Pham Peter and Pham Jenifer
Bought by
Pham Jenifer
Current Estimated Value
Home Financials for this Owner
Home Financials are based on the most recent Mortgage that was taken out on this home.
Original Mortgage
$237,000
Outstanding Balance
$101,440
Interest Rate
5.82%
Estimated Equity
$825,127
Purchase Details
Closed on
Jan 2, 2002
Sold by
Cibrian Raul and Wahlstrom Melissa A
Bought by
Do Tuyet Mai Thi
Home Financials for this Owner
Home Financials are based on the most recent Mortgage that was taken out on this home.
Original Mortgage
$180,000
Interest Rate
7.11%
Purchase Details
Closed on
May 14, 1999
Sold by
Mckinney Ivan V and Mckinney Vera J
Bought by
Cibrian Raul and Wahlstrom Melissa A
Home Financials for this Owner
Home Financials are based on the most recent Mortgage that was taken out on this home.
Original Mortgage
$171,850
Interest Rate
7.05%
Mortgage Type
FHA
Create a Home Valuation Report for This Property
The Home Valuation Report is an in-depth analysis detailing your home's value as well as a comparison with similar homes in the area
Home Values in the Area
Average Home Value in this Area
Purchase History
| Date | Buyer | Sale Price | Title Company |
|---|---|---|---|
| Pham Jenifer | -- | Orange Coast Title | |
| Do Tuyet Mai Thi | $225,000 | Commonwealth Land Title | |
| Cibrian Raul | $173,000 | Chicago Title Co |
Source: Public Records
Mortgage History
| Date | Status | Borrower | Loan Amount |
|---|---|---|---|
| Open | Pham Jenifer | $237,000 | |
| Closed | Do Tuyet Mai Thi | $180,000 | |
| Previous Owner | Cibrian Raul | $171,850 |
Source: Public Records
Tax History Compared to Growth
Tax History
| Year | Tax Paid | Tax Assessment Tax Assessment Total Assessment is a certain percentage of the fair market value that is determined by local assessors to be the total taxable value of land and additions on the property. | Land | Improvement |
|---|---|---|---|---|
| 2025 | $4,109 | $347,845 | $259,861 | $87,984 |
| 2024 | $4,109 | $341,025 | $254,766 | $86,259 |
| 2023 | $4,030 | $334,339 | $249,771 | $84,568 |
| 2022 | $3,938 | $327,784 | $244,874 | $82,910 |
| 2021 | $3,883 | $321,357 | $240,072 | $81,285 |
| 2020 | $3,835 | $318,062 | $237,610 | $80,452 |
| 2019 | $3,784 | $311,826 | $232,951 | $78,875 |
| 2018 | $3,690 | $305,712 | $228,383 | $77,329 |
| 2017 | $3,652 | $299,718 | $223,905 | $75,813 |
| 2016 | $3,493 | $293,842 | $219,515 | $74,327 |
| 2015 | $3,446 | $289,429 | $216,218 | $73,211 |
| 2014 | $3,363 | $283,760 | $211,983 | $71,777 |
Source: Public Records
Map
Nearby Homes
- 4248 W 5th St
- 4518 W 1st St
- 4201 W 5th St Unit 314
- 3932 W 5th St Unit 202
- 3929 W 5th St Unit 16
- 4832 W 5th St Unit B
- 432 S Harbor Blvd Unit 101
- 432 S Harbor Blvd Unit 64
- 432 S Harbor Blvd Unit 7
- 323 N Euclid St Unit 99
- 4117 W Mcfadden Ave
- 4117 W Mcfadden Ave Unit 623
- 4117 W Mcfadden Ave Unit 525
- 5114 W 1st St Unit C
- 4213 Fay Cir
- 4512 W Watkins Way
- 3927 W Mcfadden Ave Unit B
- 5112 W 1st St Unit C
- 1114 N Gates St
- 5132 W 1st St Unit B
- 305 N Newhope St
- 221 N Newhope St
- 309 N Newhope St
- 217 N Newhope St
- 302 N Mountain View St
- 222 N Mountain View St
- 306 N Mountain View St
- 4502 W 3rd St
- 209 N Newhope St
- 317 N Newhope St
- 218 N Mountain View St
- 310 N Mountain View St
- 214 N Newhope St
- 214 N Newhope St Unit 214E
- 214 N Newhope St Unit 214A
- 214 N Newhope St Unit 214B
- 214 N Newhope St Unit C
- 214 N Newhope St Unit D
- 212 N Newhope St Unit 212e
- 212 N Newhope St Unit C