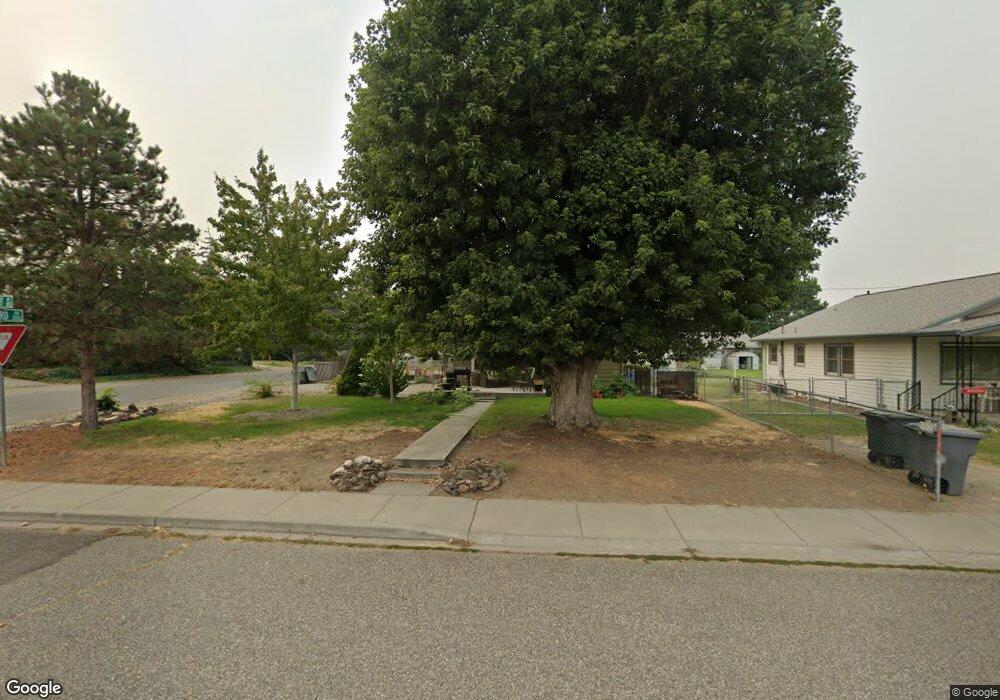
301 Robert Ave Unit Excellent Remodel! S Richland, WA 99352
Estimated Value: $211,000 - $281,000
3
Beds
1
Bath
609
Sq Ft
$418/Sq Ft
Est. Value
About This Home
This home is located at 301 Robert Ave Unit Excellent Remodel! S, Richland, WA 99352 and is currently estimated at $254,688, approximately $418 per square foot. 301 Robert Ave Unit Excellent Remodel! S is a home located in Benton County with nearby schools including Marcus Whitman Elementary School, Carmichael Middle School, and Richland High School.
Ownership History
Date
Name
Owned For
Owner Type
Purchase Details
Closed on
May 4, 2017
Sold by
J/S Brock Properties Llc
Bought by
Pulley Cynthia
Current Estimated Value
Home Financials for this Owner
Home Financials are based on the most recent Mortgage that was taken out on this home.
Original Mortgage
$10,000
Outstanding Balance
$8,316
Interest Rate
4.1%
Mortgage Type
Stand Alone Second
Estimated Equity
$246,372
Purchase Details
Closed on
Aug 5, 2016
Sold by
Herbert Karissa R and Herbert Chares L
Bought by
J/S Brock Properties Llc
Purchase Details
Closed on
Aug 2, 2016
Sold by
Guse Eugen and Guse Judith
Bought by
Herbert Karissa
Purchase Details
Closed on
Sep 28, 1978
Sold by
Nelson Doris L
Bought by
Guse Eugene and Guse Judith
Create a Home Valuation Report for This Property
The Home Valuation Report is an in-depth analysis detailing your home's value as well as a comparison with similar homes in the area
Home Values in the Area
Average Home Value in this Area
Purchase History
| Date | Buyer | Sale Price | Title Company |
|---|---|---|---|
| Pulley Cynthia | $130,000 | Stewart Title Company | |
| J/S Brock Properties Llc | $78,207 | Frontier Title & Escrow Co | |
| Herbert Karissa | $37,719 | Frontier Title & Escrow Co | |
| Guse Eugene | $13,483 | Frontier Title & Escrow Co |
Source: Public Records
Mortgage History
| Date | Status | Borrower | Loan Amount |
|---|---|---|---|
| Open | Pulley Cynthia | $10,000 | |
| Open | Pulley Cynthia | $127,645 |
Source: Public Records
Tax History Compared to Growth
Tax History
| Year | Tax Paid | Tax Assessment Tax Assessment Total Assessment is a certain percentage of the fair market value that is determined by local assessors to be the total taxable value of land and additions on the property. | Land | Improvement |
|---|---|---|---|---|
| 2024 | $162 | $95,030 | $24,000 | $71,030 |
| 2023 | $162 | $95,030 | $24,000 | $71,030 |
| 2022 | $193 | $95,030 | $24,000 | $71,030 |
| 2021 | $223 | $95,030 | $24,000 | $71,030 |
| 2020 | $232 | $129,460 | $50,000 | $79,460 |
| 2019 | $1,094 | $105,960 | $24,000 | $81,960 |
| 2018 | $1,081 | $95,030 | $24,000 | $71,030 |
| 2017 | $942 | $78,640 | $24,000 | $54,640 |
| 2016 | $929 | $78,640 | $24,000 | $54,640 |
| 2015 | $946 | $78,640 | $24,000 | $54,640 |
| 2014 | -- | $78,640 | $24,000 | $54,640 |
| 2013 | -- | $78,640 | $24,000 | $54,640 |
Source: Public Records
Map
Nearby Homes
- 302 Rossell Ave
- 211 Wright Ave
- 2209 Boise St
- 1416 Agnes St
- 2305 Concord St
- 1088 Makah Ct
- 2109 Duportail St
- 2404 Dallas St
- 2120 Duportail St Unit 1
- 2377 Maggio Loop
- 2402 Dover St
- 503 Wright Ave Unit B8
- 2407 Duportail St
- 513 Winslow Ave
- 405 Basswood Ave
- 626 Snow Ave
- 1006 Adams St
- 713 Sanford Ave
- 504 Douglass Ave
- 901 Downing St
- 301 Robert Ave Unit Oh! The Possibilitie
- 301 Robert Ave
- 303 Robert Ave
- 305 Robert Ave
- 304 Rossell Ave
- 306 Sanford Ave
- 315 Sanford Ave
- 307 Robert Ave
- 304 Robert Ave
- 307 Sanford Ave
- 308 Rossell Ave
- 309 Robert Ave
- 319 Sanford Ave
- 304 Sanford Ave
- 306 Robert Ave
- 321 Sanford Ave
- 310 Rossell Ave
- 305 Sanford Ave
- 311 Robert Ave
- 308 Robert Ave