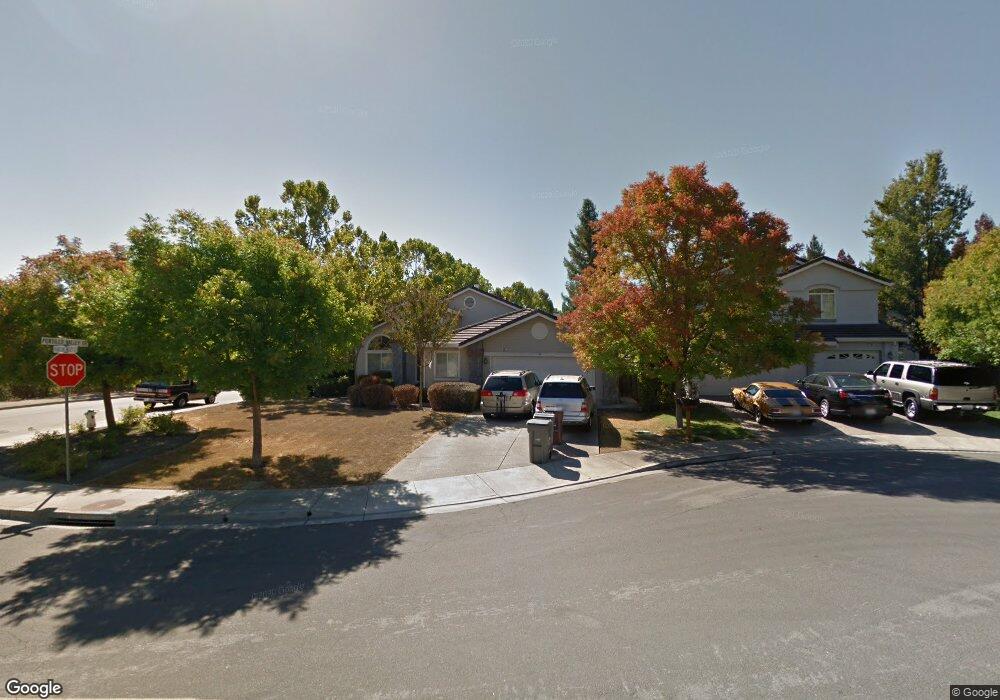
301 Rubicon Valley San Ramon, CA 94582
Gale Ranch-Windemere NeighborhoodEstimated Value: $1,594,937 - $1,948,000
4
Beds
2
Baths
2,042
Sq Ft
$870/Sq Ft
Est. Value
About This Home
This home is located at 301 Rubicon Valley, San Ramon, CA 94582 and is currently estimated at $1,776,484, approximately $869 per square foot. 301 Rubicon Valley is a home located in Contra Costa County with nearby schools including Country Club Elementary School, Pine Valley Middle School, and California High School.
Ownership History
Date
Name
Owned For
Owner Type
Purchase Details
Closed on
May 9, 2001
Sold by
Chan William Lum and Chan Janet Ann
Bought by
Chan William Lum and Chan Janet Ann
Current Estimated Value
Home Financials for this Owner
Home Financials are based on the most recent Mortgage that was taken out on this home.
Original Mortgage
$380,000
Outstanding Balance
$152,256
Interest Rate
8.02%
Mortgage Type
Purchase Money Mortgage
Estimated Equity
$1,624,228
Purchase Details
Closed on
Sep 3, 1997
Sold by
Chan William Lum and Yee Janet Ann
Bought by
Chan William Lum and Yee Janet Ann
Purchase Details
Closed on
Sep 27, 1996
Sold by
Ponderosa Homes Inc
Bought by
Chan William Lum and Yee Janet Ann
Home Financials for this Owner
Home Financials are based on the most recent Mortgage that was taken out on this home.
Original Mortgage
$266,600
Interest Rate
7.5%
Mortgage Type
Purchase Money Mortgage
Create a Home Valuation Report for This Property
The Home Valuation Report is an in-depth analysis detailing your home's value as well as a comparison with similar homes in the area
Home Values in the Area
Average Home Value in this Area
Purchase History
| Date | Buyer | Sale Price | Title Company |
|---|---|---|---|
| Chan William Lum | -- | North American Title Co | |
| Chan William Lum | -- | First American | |
| Chan William Lum | $333,500 | First American Title Guarant |
Source: Public Records
Mortgage History
| Date | Status | Borrower | Loan Amount |
|---|---|---|---|
| Open | Chan William Lum | $380,000 | |
| Closed | Chan William Lum | $266,600 |
Source: Public Records
Tax History Compared to Growth
Tax History
| Year | Tax Paid | Tax Assessment Tax Assessment Total Assessment is a certain percentage of the fair market value that is determined by local assessors to be the total taxable value of land and additions on the property. | Land | Improvement |
|---|---|---|---|---|
| 2025 | $8,799 | $542,785 | $228,005 | $314,780 |
| 2024 | $8,688 | $532,143 | $223,535 | $308,608 |
| 2023 | $8,688 | $521,709 | $219,152 | $302,557 |
| 2022 | $8,641 | $511,480 | $214,855 | $296,625 |
| 2021 | $8,517 | $501,452 | $210,643 | $290,809 |
| 2019 | $8,370 | $486,582 | $204,397 | $282,185 |
| 2018 | $8,144 | $477,042 | $200,390 | $276,652 |
| 2017 | $6,106 | $467,689 | $196,461 | $271,228 |
| 2016 | $6,030 | $458,519 | $192,609 | $265,910 |
| 2015 | $5,977 | $451,632 | $189,716 | $261,916 |
| 2014 | $5,911 | $442,786 | $186,000 | $256,786 |
Source: Public Records
Map
Nearby Homes
- 2141 Bent Creek Dr
- 5430 Sherwood Way
- 8043 Crossridge Rd
- 6 San Pedro Place
- 9104 Craydon Cir
- 820 Pinehurst Place
- 9014 Craydon Cir
- 9054 Craydon Cir
- 9048 Craydon Cir
- 54 Madrid Place
- 7813 Shady Creek Rd
- 9832 Del Mar Dr
- 6130 Yardley Ln
- 8351 Mulberry Place
- 39 Elmwood Dr
- 1628 Banbury Dr
- 1 Lupine Ln
- 3217 Ensenada Dr
- 6132 Alpine Blue Dr
- 9085 Alcosta Blvd Unit 374
- 305 Rubicon Valley
- 5240 Portillo Valley
- 300 Rubicon Valley
- 309 Rubicon Valley
- 5230 Portillo Valley
- 304 Rubicon Valley Ct
- 304 Rubicon Valley
- 308 Rubicon Valley
- 101 Wildflower Valley Ct
- 105 Wildflower Valley Ct
- 266 Sun Ridge Dr
- 212 Alderwood Ln
- 5210 Portillo Valley Dr
- 5210 Portillo Valley
- 415 Sunnyside Place
- 3021 Summit View Dr
- 4011 Summit View Dr
- 5200 Portillo Valley
- 215 Alderwood Ln
- 262 Sun Ridge Dr