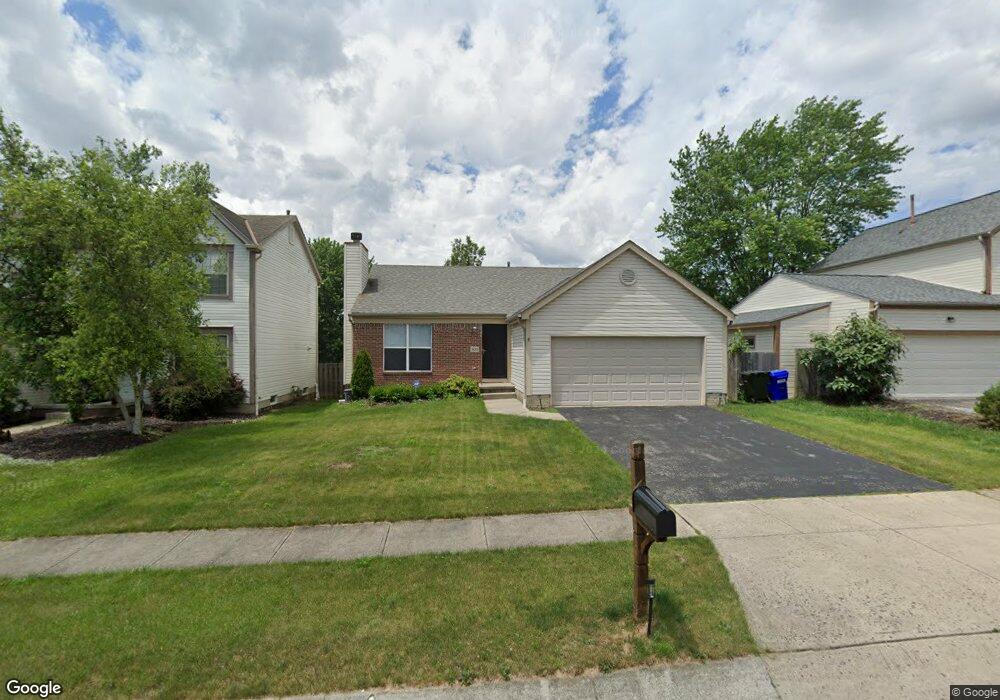
3011 Hollybank Rd Reynoldsburg, OH 43068
Estimated Value: $298,558 - $321,000
3
Beds
2
Baths
1,173
Sq Ft
$260/Sq Ft
Est. Value
About This Home
This home is located at 3011 Hollybank Rd, Reynoldsburg, OH 43068 and is currently estimated at $304,890, approximately $259 per square foot. 3011 Hollybank Rd is a home located in Fairfield County with nearby schools including Tussing Elementary School, Harmon Middle School, and Pickerington Ridgeview Junior High School.
Ownership History
Date
Name
Owned For
Owner Type
Purchase Details
Closed on
Nov 2, 2022
Sold by
Mcclellan Kelly J and Mcclellan Lori L
Bought by
Chatman Rodney A
Current Estimated Value
Home Financials for this Owner
Home Financials are based on the most recent Mortgage that was taken out on this home.
Original Mortgage
$265,978
Outstanding Balance
$256,786
Interest Rate
6.7%
Mortgage Type
VA
Estimated Equity
$48,105
Purchase Details
Closed on
Nov 13, 2006
Sold by
S A R Construction Co
Bought by
Mcclellan Kelly J and Kelley Lori L
Purchase Details
Closed on
Nov 24, 1997
Sold by
Mitran Land Ltd Liabilit
Bought by
S A R Const Co
Home Financials for this Owner
Home Financials are based on the most recent Mortgage that was taken out on this home.
Original Mortgage
$94,300
Interest Rate
7.38%
Mortgage Type
New Conventional
Create a Home Valuation Report for This Property
The Home Valuation Report is an in-depth analysis detailing your home's value as well as a comparison with similar homes in the area
Home Values in the Area
Average Home Value in this Area
Purchase History
| Date | Buyer | Sale Price | Title Company |
|---|---|---|---|
| Chatman Rodney A | $260,000 | None Listed On Document | |
| Mcclellan Kelly J | $94,000 | Attorney | |
| S A R Const Co | $22,200 | -- |
Source: Public Records
Mortgage History
| Date | Status | Borrower | Loan Amount |
|---|---|---|---|
| Open | Chatman Rodney A | $265,978 | |
| Previous Owner | S A R Const Co | $94,300 |
Source: Public Records
Tax History Compared to Growth
Tax History
| Year | Tax Paid | Tax Assessment Tax Assessment Total Assessment is a certain percentage of the fair market value that is determined by local assessors to be the total taxable value of land and additions on the property. | Land | Improvement |
|---|---|---|---|---|
| 2024 | $7,199 | $73,120 | $11,140 | $61,980 |
| 2023 | $2,844 | $73,120 | $11,140 | $61,980 |
| 2022 | $2,642 | $66,060 | $11,140 | $54,920 |
| 2021 | $2,350 | $50,680 | $8,570 | $42,110 |
| 2020 | $2,376 | $50,680 | $8,570 | $42,110 |
| 2019 | $2,393 | $50,680 | $8,570 | $42,110 |
| 2018 | $2,018 | $38,430 | $7,850 | $30,580 |
| 2017 | $2,020 | $37,720 | $7,140 | $30,580 |
| 2016 | $2,006 | $37,720 | $7,140 | $30,580 |
| 2015 | $1,921 | $34,330 | $7,140 | $27,190 |
| 2014 | $1,893 | $34,330 | $7,140 | $27,190 |
| 2013 | $1,893 | $34,330 | $7,140 | $27,190 |
Source: Public Records
Map
Nearby Homes
- 3072 Bocastle Ct
- 3099 Ambarwent Rd
- 3021 Sumner Dr
- 3124 Creighton Place
- 6926 Bennell Dr
- 3188 Creighton Place
- 6775 Centennial Dr
- 3292 Draycott Ct
- 7350 Aplin Dr
- 2826-2828 Continental Dr
- 3133 Earlington Ln
- 3265 O'Heagra Dr
- 3205 Mahaffey Ct
- 3212 Southern Hills Dr
- 3233 Mahaffey Ct
- 3161 Innisbrook Ct
- 6605 Hancock Ct
- 7287 Candlestone Dr
- 3358 Cargin Ct
- 2909 Princeville Dr
- 3017 Hollybank Rd
- 3005 Hollybank Rd
- 3023 Hollybank Rd
- 7049 Furrow Rd
- 2966 Ambarwent Rd
- 2960 Ambarwent Rd
- 2972 Ambarwent Rd
- 3029 Hollybank Rd
- 7043 Furrow Rd
- 2978 Ambarwent Rd
- 3018 Hollybank Rd
- 3006 Hollybank Rd
- 7037 Furrow Rd
- 3024 Hollybank Rd
- 3000 Hollybank Rd
- 3035 Hollybank Rd
- 2984 Ambarwent Rd
- 3030 Hollybank Rd
- 7064 Furrow
- 7064 Furrow Rd