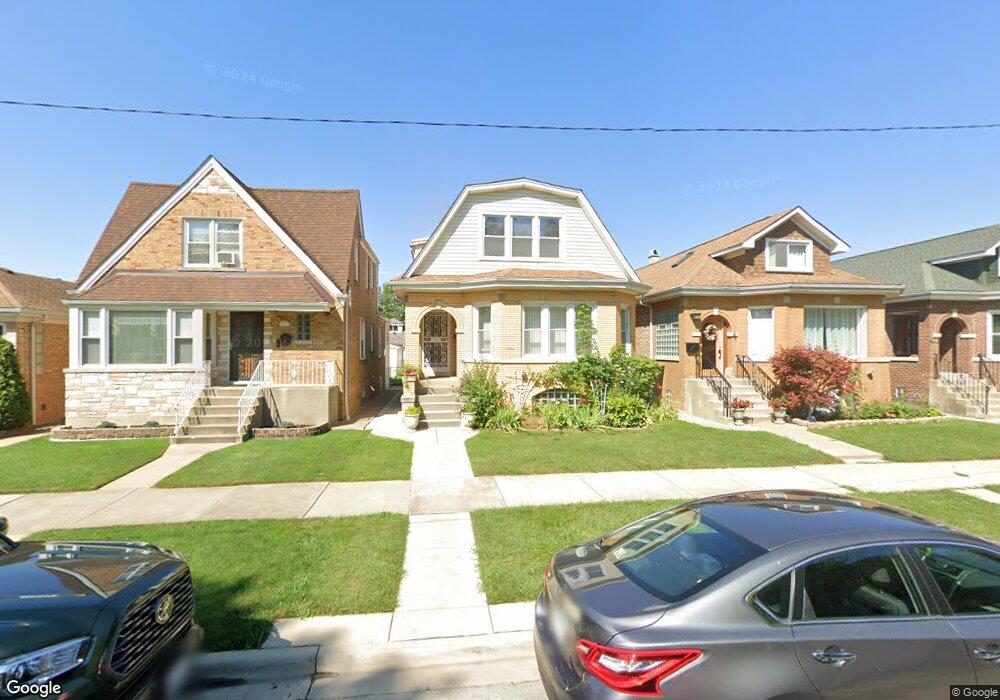
3012 N Newcastle Ave Chicago, IL 60634
Montclare NeighborhoodEstimated Value: $430,000 - $518,000
4
Beds
4
Baths
2,113
Sq Ft
$225/Sq Ft
Est. Value
About This Home
This home is located at 3012 N Newcastle Ave, Chicago, IL 60634 and is currently estimated at $474,608, approximately $224 per square foot. 3012 N Newcastle Ave is a home located in Cook County with nearby schools including Locke J Elementary School, Steinmetz College Prep, and Icci Academy.
Ownership History
Date
Name
Owned For
Owner Type
Purchase Details
Closed on
May 20, 2011
Sold by
Pezda Jozef and Ujcik Aneta
Bought by
Ujcik Aneta and Gyulnazaryan Renata Guellard
Current Estimated Value
Purchase Details
Closed on
Nov 21, 2008
Sold by
Pezda Jozef and Pezda Zofia
Bought by
Pezda Jozef and Ujcik Aneta
Purchase Details
Closed on
Aug 15, 1995
Sold by
Janicki Jan
Bought by
Pezda Jozef and Pezda Zofia
Home Financials for this Owner
Home Financials are based on the most recent Mortgage that was taken out on this home.
Original Mortgage
$130,000
Interest Rate
7.5%
Purchase Details
Closed on
Aug 2, 1995
Sold by
Pioneer Bank & Trust Company
Bought by
Pezda Jozef and Pezda Zofia
Home Financials for this Owner
Home Financials are based on the most recent Mortgage that was taken out on this home.
Original Mortgage
$130,000
Interest Rate
7.5%
Create a Home Valuation Report for This Property
The Home Valuation Report is an in-depth analysis detailing your home's value as well as a comparison with similar homes in the area
Home Values in the Area
Average Home Value in this Area
Purchase History
| Date | Buyer | Sale Price | Title Company |
|---|---|---|---|
| Ujcik Aneta | -- | None Available | |
| Pezda Jozef | -- | None Available | |
| Pezda Jozef | -- | -- | |
| Pezda Jozef | $145,000 | -- |
Source: Public Records
Mortgage History
| Date | Status | Borrower | Loan Amount |
|---|---|---|---|
| Previous Owner | Pezda Jozef | $130,000 |
Source: Public Records
Tax History Compared to Growth
Tax History
| Year | Tax Paid | Tax Assessment Tax Assessment Total Assessment is a certain percentage of the fair market value that is determined by local assessors to be the total taxable value of land and additions on the property. | Land | Improvement |
|---|---|---|---|---|
| 2024 | $2,603 | $41,000 | $11,718 | $29,282 |
| 2023 | $2,618 | $35,000 | $9,450 | $25,550 |
| 2022 | $2,618 | $35,000 | $9,450 | $25,550 |
| 2021 | $2,493 | $35,000 | $9,450 | $25,550 |
| 2020 | $2,572 | $32,841 | $4,725 | $28,116 |
| 2019 | $2,564 | $36,900 | $4,725 | $32,175 |
| 2018 | $2,526 | $36,900 | $4,725 | $32,175 |
| 2017 | $2,704 | $29,110 | $4,158 | $24,952 |
| 2016 | $3,088 | $29,110 | $4,158 | $24,952 |
| 2015 | $2,968 | $29,110 | $4,158 | $24,952 |
| 2014 | $2,943 | $20,734 | $3,780 | $16,954 |
| 2013 | $2,953 | $20,734 | $3,780 | $16,954 |
Source: Public Records
Map
Nearby Homes
- 3011 N Oak Park Ave
- 2930 N New England Ave
- 6934 W Oakdale Ave
- 6938 W Barry Ave
- 3121 N Normandy Ave
- 6736 W Belmont Ave
- 2846 N Sayre Ave
- 3105 N Nordica Ave
- 3120 N Natoma Ave
- 6653 W Belmont Ave
- 6944 W Diversey Ave Unit 3S
- 6643 W Belmont Ave Unit 1
- 6964 W Diversey Ave Unit 6
- 2747 N Oak Park Ave
- 3247 N Rutherford Ave
- 6556 W Barry Ave Unit E
- 6565 W Belmont Ave Unit 104N
- 3111 N Nashville Ave Unit 1E
- 3312 N New England Ave
- 2714 N New England Ave
- 3016 N Newcastle Ave
- 3008 N Newcastle Ave
- 3018 N Newcastle Ave
- 3006 N Newcastle Ave
- 3022 N Newcastle Ave
- 3004 N Newcastle Ave
- 3024 N Newcastle Ave
- 3000 N Newcastle Ave
- 3013 N New England Ave
- 3011 N New England Ave
- 3015 N New England Ave
- 3015 N New England Ave
- 3015 N New England Ave Unit 1
- 3028 N Newcastle Ave
- 3007 N New England Ave
- 3023 N New England Ave
- 3005 N New England Ave
- 3025 N New England Ave
- 3001 N New England Ave
- 3029 N New England Ave