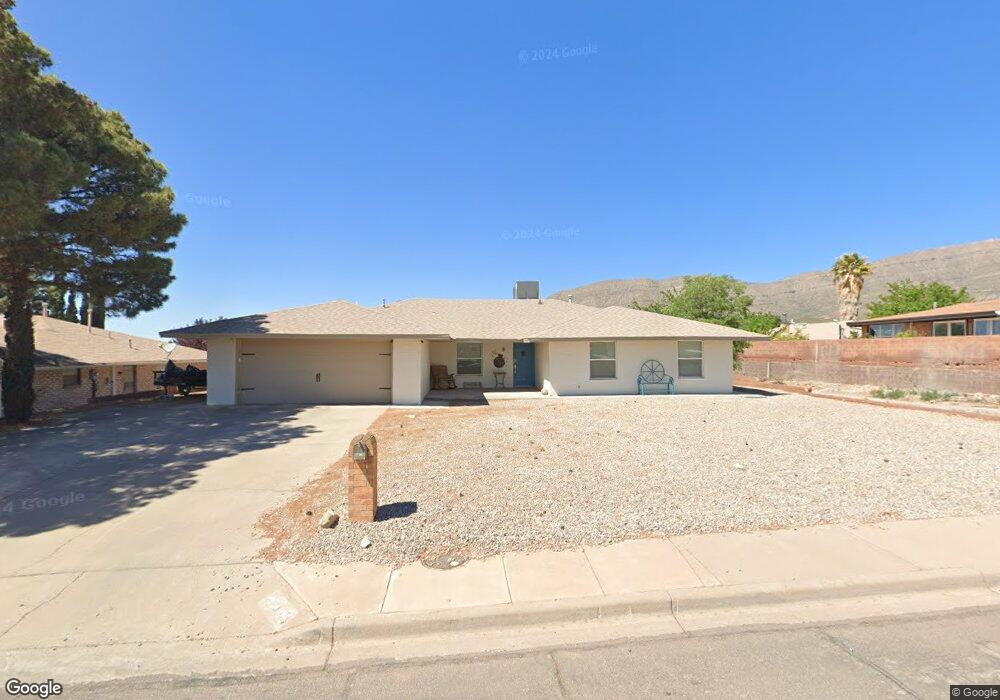
3013 Sunland Dr Unit 7 Alamogordo, NM 88310
Estimated Value: $247,000 - $292,000
4
Beds
3
Baths
2,079
Sq Ft
$130/Sq Ft
Est. Value
About This Home
This home is located at 3013 Sunland Dr Unit 7, Alamogordo, NM 88310 and is currently estimated at $269,288, approximately $129 per square foot. 3013 Sunland Dr Unit 7 is a home located in Otero County with nearby schools including Yucca Elementary School, Sunset Hills Elementary, and Chaparral Middle School.
Ownership History
Date
Name
Owned For
Owner Type
Purchase Details
Closed on
Apr 15, 2021
Sold by
Martin Erica and Martinez Erica
Bought by
Martinez Erica
Current Estimated Value
Home Financials for this Owner
Home Financials are based on the most recent Mortgage that was taken out on this home.
Original Mortgage
$113,602
Outstanding Balance
$85,357
Interest Rate
3.05%
Mortgage Type
New Conventional
Estimated Equity
$183,931
Purchase Details
Closed on
Sep 20, 2007
Sold by
Chandler Terry
Bought by
Martin Dominick and Martin Erica
Purchase Details
Closed on
Oct 10, 2005
Sold by
Myers Margie O
Bought by
Chandler Terry
Home Financials for this Owner
Home Financials are based on the most recent Mortgage that was taken out on this home.
Original Mortgage
$150,301
Interest Rate
5.69%
Mortgage Type
VA
Create a Home Valuation Report for This Property
The Home Valuation Report is an in-depth analysis detailing your home's value as well as a comparison with similar homes in the area
Home Values in the Area
Average Home Value in this Area
Purchase History
| Date | Buyer | Sale Price | Title Company |
|---|---|---|---|
| Martinez Erica | -- | Casa Y Tierra Abstract & Ttl | |
| Martin Dominick | -- | None Available | |
| Chandler Terry | -- | None Available |
Source: Public Records
Mortgage History
| Date | Status | Borrower | Loan Amount |
|---|---|---|---|
| Open | Martinez Erica | $113,602 | |
| Previous Owner | Chandler Terry | $150,301 |
Source: Public Records
Tax History Compared to Growth
Tax History
| Year | Tax Paid | Tax Assessment Tax Assessment Total Assessment is a certain percentage of the fair market value that is determined by local assessors to be the total taxable value of land and additions on the property. | Land | Improvement |
|---|---|---|---|---|
| 2025 | $1,583 | $62,034 | $7,608 | $54,426 |
| 2024 | $1,529 | $60,228 | $6,846 | $53,382 |
| 2023 | $1,511 | $58,473 | $6,133 | $52,340 |
| 2022 | $1,478 | $56,770 | $6,133 | $50,637 |
| 2021 | $1,469 | $55,774 | $6,133 | $49,641 |
| 2020 | $1,469 | $55,774 | $6,133 | $49,641 |
| 2019 | $1,449 | $54,680 | $6,013 | $48,667 |
| 2018 | $1,411 | $54,139 | $5,953 | $48,181 |
| 2017 | $1,298 | $53,078 | $5,836 | $47,236 |
| 2016 | $1,263 | $52,037 | $0 | $0 |
| 2015 | $1,237 | $51,017 | $0 | $0 |
| 2014 | -- | $50,016 | $5,500 | $44,516 |
Source: Public Records
Map
Nearby Homes
- 1010 Sundial Ave
- 604 Sunnyside Ave
- 3023 Sunrise Ave
- 600 Sunnyside Ave
- 2906 Sunland Dr
- 506 Sunglow Ave
- 609 Sunrise Ave Unit 1
- 3005 Shawnee Trail
- 404 Sunbeam Ave
- 3012 Cherokee Trail
- 3108 Abbott Ave
- 3213 Sunny Cir
- 3008 Thunder Rd
- 1310 Hendrix Ave
- 215 Shadow Mountain Dr
- 0 Thunder Rd Unit 40
- 1003 Scenic Dr
- 3305 Thunder Rd
- 3515 Thunder Rd
- Lot 37 Thunder Rd Unit 37
- 3013 Sunland Dr
- 3011 Sunland Dr
- 1005 Sundial Ave
- 1007 Sundial Ave
- 3012 Sunrise Ave
- 3010 Sunrise Ave
- 3009 Sunland Dr
- 3012 Sunland Dr
- 3010 Sunland Dr
- 1003 Sundial Ave
- 3014 Sunrise Ave
- 3008 Sunrise Ave
- 3008 Sunland Dr
- 3007 Sunland Dr
- 3007 Sunland Dr Unit 7
- 1006 Sundial Ave
- 3006 Sunrise Ave
- 1004 Sundial Ave
- 3006 Sunland Dr
- 1008 Sundial Ave