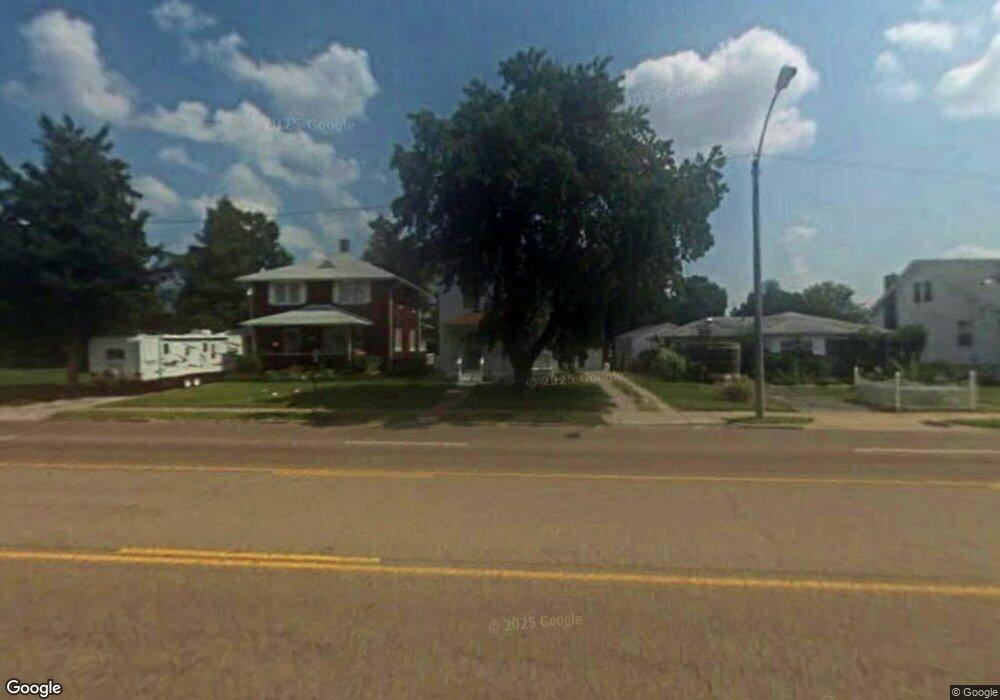
3019 W Main St Belleville, IL 62226
Estimated Value: $104,000 - $126,038
--
Bed
--
Bath
768
Sq Ft
$149/Sq Ft
Est. Value
About This Home
This home is located at 3019 W Main St, Belleville, IL 62226 and is currently estimated at $114,510, approximately $149 per square foot. 3019 W Main St is a home located in St. Clair County with nearby schools including Union Elementary School, West Jr High School, and Our Lady Queen Of Peace Catholic School.
Ownership History
Date
Name
Owned For
Owner Type
Purchase Details
Closed on
Jun 8, 2018
Sold by
Bickel Astra L and Foster Astra L
Bought by
Bickel Astra L and Bickel Martin D
Current Estimated Value
Purchase Details
Closed on
Jun 21, 2007
Sold by
Slack Pamela A
Bought by
Foster Astra L
Home Financials for this Owner
Home Financials are based on the most recent Mortgage that was taken out on this home.
Original Mortgage
$50,000
Outstanding Balance
$30,711
Interest Rate
6.26%
Mortgage Type
Purchase Money Mortgage
Estimated Equity
$83,799
Create a Home Valuation Report for This Property
The Home Valuation Report is an in-depth analysis detailing your home's value as well as a comparison with similar homes in the area
Home Values in the Area
Average Home Value in this Area
Purchase History
| Date | Buyer | Sale Price | Title Company |
|---|---|---|---|
| Bickel Astra L | -- | Benchmark Title Co Llc | |
| Foster Astra L | $50,000 | Community Title Shiloh |
Source: Public Records
Mortgage History
| Date | Status | Borrower | Loan Amount |
|---|---|---|---|
| Open | Foster Astra L | $50,000 |
Source: Public Records
Tax History Compared to Growth
Tax History
| Year | Tax Paid | Tax Assessment Tax Assessment Total Assessment is a certain percentage of the fair market value that is determined by local assessors to be the total taxable value of land and additions on the property. | Land | Improvement |
|---|---|---|---|---|
| 2024 | $2,579 | $35,330 | $4,282 | $31,048 |
| 2023 | $2,196 | $29,392 | $4,197 | $25,195 |
| 2022 | $1,958 | $26,460 | $3,778 | $22,682 |
| 2021 | $1,841 | $24,462 | $3,493 | $20,969 |
| 2020 | $0 | $23,132 | $3,303 | $19,829 |
| 2019 | $554 | $23,197 | $3,309 | $19,888 |
| 2018 | $554 | $22,695 | $3,237 | $19,458 |
| 2017 | $872 | $22,535 | $3,214 | $19,321 |
| 2016 | $1,689 | $22,057 | $3,146 | $18,911 |
| 2014 | $887 | $25,193 | $4,354 | $20,839 |
| 2013 | $1,806 | $25,553 | $4,416 | $21,137 |
Source: Public Records
Map
Nearby Homes