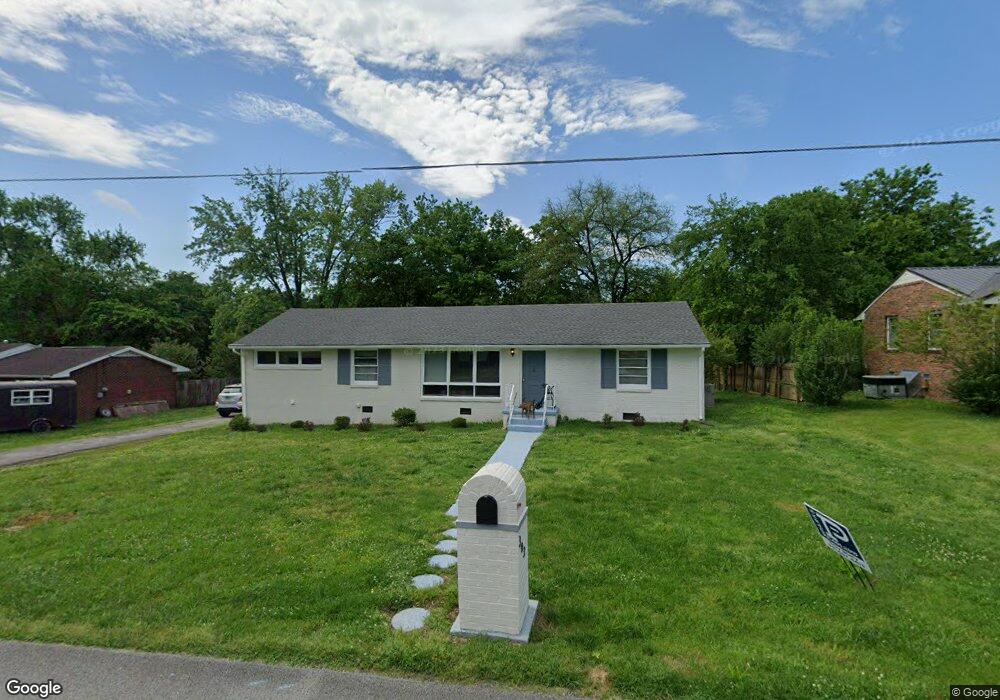
302 Davis St Shelbyville, TN 37160
Estimated Value: $230,000 - $265,381
2
Beds
1
Bath
1,225
Sq Ft
$203/Sq Ft
Est. Value
About This Home
This home is located at 302 Davis St, Shelbyville, TN 37160 and is currently estimated at $249,095, approximately $203 per square foot. 302 Davis St is a home located in Bedford County with nearby schools including South Side Elementary School, Harris Middle School, and Shelbyville Central High School.
Ownership History
Date
Name
Owned For
Owner Type
Purchase Details
Closed on
Nov 30, 2023
Sold by
Hendrix Jessica M
Bought by
Romero Jessica and Romero Jesus
Current Estimated Value
Home Financials for this Owner
Home Financials are based on the most recent Mortgage that was taken out on this home.
Original Mortgage
$203,500
Outstanding Balance
$200,205
Interest Rate
7.63%
Mortgage Type
FHA
Estimated Equity
$48,890
Purchase Details
Closed on
Nov 24, 2009
Sold by
Fleming Timothy A
Bought by
Fleming Jessica M
Purchase Details
Closed on
Jun 13, 2007
Sold by
Adkins Charles
Bought by
Fleming Timothy A
Purchase Details
Closed on
Feb 20, 1969
Bought by
Adkins Charles and Adkins Irene
Create a Home Valuation Report for This Property
The Home Valuation Report is an in-depth analysis detailing your home's value as well as a comparison with similar homes in the area
Home Values in the Area
Average Home Value in this Area
Purchase History
| Date | Buyer | Sale Price | Title Company |
|---|---|---|---|
| Romero Jessica | -- | None Listed On Document | |
| Romero Jessica | -- | None Listed On Document | |
| Fleming Jessica M | -- | -- | |
| Fleming Timothy A | $83,000 | -- | |
| Adkins Charles | -- | -- |
Source: Public Records
Mortgage History
| Date | Status | Borrower | Loan Amount |
|---|---|---|---|
| Open | Romero Jessica | $203,500 | |
| Closed | Romero Jessica | $203,500 |
Source: Public Records
Tax History Compared to Growth
Tax History
| Year | Tax Paid | Tax Assessment Tax Assessment Total Assessment is a certain percentage of the fair market value that is determined by local assessors to be the total taxable value of land and additions on the property. | Land | Improvement |
|---|---|---|---|---|
| 2025 | -- | $40,200 | $0 | $0 |
| 2024 | -- | $40,200 | $10,725 | $29,475 |
| 2023 | $1,468 | $38,575 | $10,725 | $27,850 |
| 2022 | $1,510 | $38,575 | $10,725 | $27,850 |
| 2021 | $1,371 | $38,575 | $10,725 | $27,850 |
| 2020 | $916 | $38,575 | $10,725 | $27,850 |
| 2019 | $916 | $20,675 | $3,750 | $16,925 |
| 2018 | $895 | $20,675 | $3,750 | $16,925 |
| 2017 | $895 | $20,675 | $3,750 | $16,925 |
| 2016 | $887 | $20,675 | $3,750 | $16,925 |
| 2015 | $887 | $20,675 | $3,750 | $16,925 |
| 2014 | $789 | $20,137 | $0 | $0 |
Source: Public Records
Map
Nearby Homes