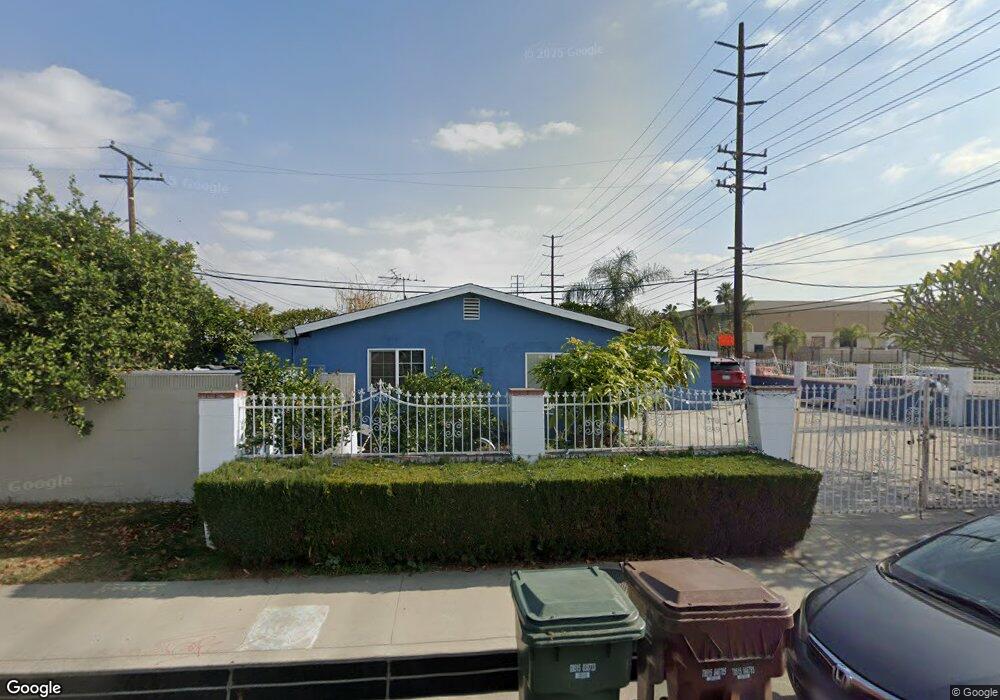
302 Millbury Ave La Puente, CA 91746
West Puente Valley NeighborhoodEstimated Value: $685,000 - $776,000
3
Beds
2
Baths
1,050
Sq Ft
$682/Sq Ft
Est. Value
About This Home
This home is located at 302 Millbury Ave, La Puente, CA 91746 and is currently estimated at $715,710, approximately $681 per square foot. 302 Millbury Ave is a home located in Los Angeles County with nearby schools including J.E. Van Wig Elementary School, Torch Middle School, and Bassett Senior High School.
Ownership History
Date
Name
Owned For
Owner Type
Purchase Details
Closed on
Sep 10, 2004
Sold by
Palacios Gonzalo and Padilla Florentina
Bought by
Palacios Florentina
Current Estimated Value
Home Financials for this Owner
Home Financials are based on the most recent Mortgage that was taken out on this home.
Original Mortgage
$200,800
Outstanding Balance
$103,569
Interest Rate
6.5%
Mortgage Type
New Conventional
Estimated Equity
$612,141
Purchase Details
Closed on
Nov 21, 2000
Sold by
Zamudio Juan and Zamudio Elvira
Bought by
Palacios Gonzalo and Padilla Florentina
Home Financials for this Owner
Home Financials are based on the most recent Mortgage that was taken out on this home.
Original Mortgage
$161,466
Interest Rate
7.08%
Mortgage Type
FHA
Purchase Details
Closed on
Oct 17, 1994
Sold by
Zamudio Antonio and Zamudio Aurora D
Bought by
Zamudio Juan and Zamudio Elvira
Create a Home Valuation Report for This Property
The Home Valuation Report is an in-depth analysis detailing your home's value as well as a comparison with similar homes in the area
Home Values in the Area
Average Home Value in this Area
Purchase History
| Date | Buyer | Sale Price | Title Company |
|---|---|---|---|
| Palacios Florentina | -- | United General Title Company | |
| Palacios Gonzalo | $164,000 | Fidelity Title | |
| Zamudio Juan | -- | -- |
Source: Public Records
Mortgage History
| Date | Status | Borrower | Loan Amount |
|---|---|---|---|
| Open | Palacios Florentina | $200,800 | |
| Previous Owner | Palacios Gonzalo | $161,466 |
Source: Public Records
Tax History Compared to Growth
Tax History
| Year | Tax Paid | Tax Assessment Tax Assessment Total Assessment is a certain percentage of the fair market value that is determined by local assessors to be the total taxable value of land and additions on the property. | Land | Improvement |
|---|---|---|---|---|
| 2025 | $4,916 | $357,468 | $271,868 | $85,600 |
| 2024 | $4,916 | $350,460 | $266,538 | $83,922 |
| 2023 | $4,771 | $343,589 | $261,312 | $82,277 |
| 2022 | $4,570 | $336,853 | $256,189 | $80,664 |
| 2021 | $4,490 | $330,249 | $251,166 | $79,083 |
| 2019 | $4,381 | $320,456 | $243,717 | $76,739 |
| 2018 | $4,182 | $314,174 | $238,939 | $75,235 |
| 2016 | $4,022 | $301,975 | $229,661 | $72,314 |
| 2015 | $3,924 | $297,440 | $226,212 | $71,228 |
| 2014 | $3,738 | $291,614 | $221,781 | $69,833 |
Source: Public Records
Map
Nearby Homes
- 13622 Hartsville St
- 13426 Austen Way
- 13903 Moccasin St
- 335 Willow Ave
- 13540 Valley Blvd
- 208 S 2nd Ave
- 452 Willow Ave
- 610 Willow Ave
- 720 Le Borgne Ave
- 433 Sunkist Ave
- 338 S 4th Ave
- 234 S Covina Blvd
- 915 Stichman Ave
- 320 S 5th Ave
- 544 N Orange Ave Unit B
- 421 S 5th Ave
- 1003 Le Borgne Ave
- 979 Willow Ave Unit 31
- 943 Willow Ave
- 717 Pamela Kay Ln
- 13609 Nelson Ave
- 13602 Flagstaff St
- 13608 Flagstaff St
- 13615 Nelson Ave
- 303 Millbury Ave
- 13614 Flagstaff St
- 315 Millbury Ave
- 13621 Nelson Ave
- 13620 Flagstaff St
- 321 Millbury Ave
- 302 Big Dalton Ave
- 326 Millbury Ave
- 13627 Nelson Ave
- 308 Big Dalton Ave
- 13609 Flagstaff St
- 327 Millbury Ave
- 13626 Flagstaff St
- 314 Big Dalton Ave
- 13615 Flagstaff St