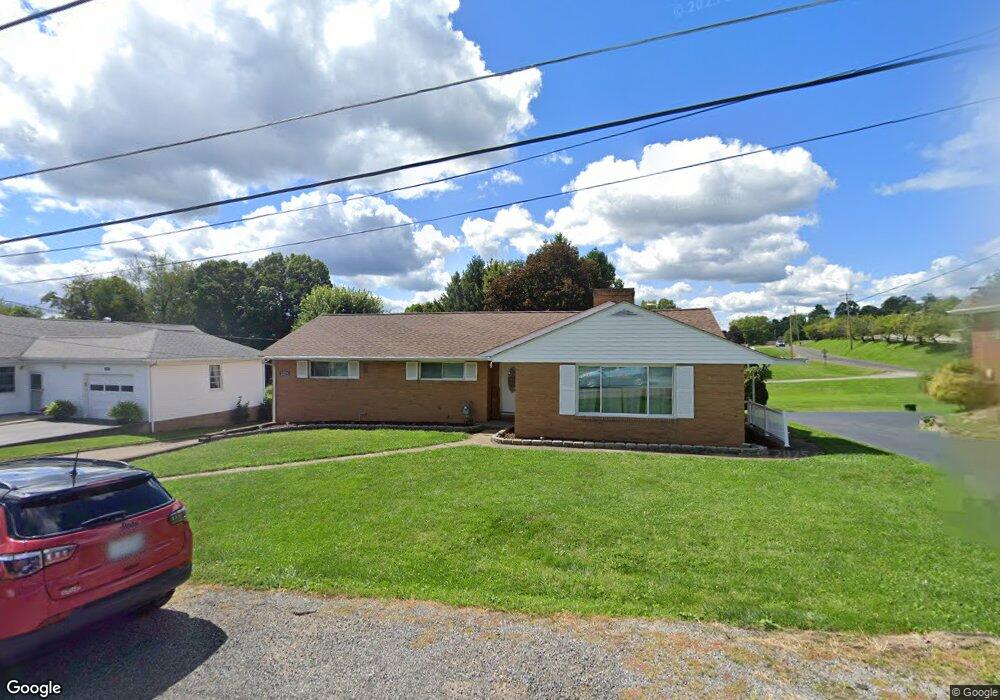
3025 Meadow Rd East Liverpool, OH 43920
Estimated Value: $179,611 - $227,000
3
Beds
2
Baths
1,589
Sq Ft
$128/Sq Ft
Est. Value
About This Home
This home is located at 3025 Meadow Rd, East Liverpool, OH 43920 and is currently estimated at $203,903, approximately $128 per square foot. 3025 Meadow Rd is a home located in Columbiana County with nearby schools including Westgate Middle School, North Elementary School, and East Liverpool High School.
Ownership History
Date
Name
Owned For
Owner Type
Purchase Details
Closed on
Nov 29, 2020
Sold by
Moore Trust and Moore Kip James
Bought by
Carr Brandon L
Current Estimated Value
Home Financials for this Owner
Home Financials are based on the most recent Mortgage that was taken out on this home.
Original Mortgage
$54,003
Outstanding Balance
$48,165
Interest Rate
2.8%
Mortgage Type
FHA
Estimated Equity
$155,738
Purchase Details
Closed on
Nov 27, 2020
Sold by
Moore Kip James and Moore Trust
Bought by
Carr Brandon L
Home Financials for this Owner
Home Financials are based on the most recent Mortgage that was taken out on this home.
Original Mortgage
$54,003
Outstanding Balance
$48,165
Interest Rate
2.8%
Mortgage Type
FHA
Estimated Equity
$155,738
Purchase Details
Closed on
Dec 20, 1999
Sold by
Moore James A
Bought by
Moore James A and Moore Kip James
Purchase Details
Closed on
Sep 18, 1992
Sold by
Moore James A
Bought by
Carr Ralph L and Or Christy
Create a Home Valuation Report for This Property
The Home Valuation Report is an in-depth analysis detailing your home's value as well as a comparison with similar homes in the area
Home Values in the Area
Average Home Value in this Area
Purchase History
| Date | Buyer | Sale Price | Title Company |
|---|---|---|---|
| Carr Brandon L | -- | None Listed On Document | |
| Carr Brandon L | $55,000 | None Available | |
| Moore James A | -- | -- | |
| Carr Ralph L | $55,000 | -- |
Source: Public Records
Mortgage History
| Date | Status | Borrower | Loan Amount |
|---|---|---|---|
| Open | Carr Brandon L | $54,003 | |
| Closed | Carr Brandon L | $54,003 |
Source: Public Records
Tax History Compared to Growth
Tax History
| Year | Tax Paid | Tax Assessment Tax Assessment Total Assessment is a certain percentage of the fair market value that is determined by local assessors to be the total taxable value of land and additions on the property. | Land | Improvement |
|---|---|---|---|---|
| 2024 | $1,808 | $44,350 | $4,830 | $39,520 |
| 2023 | $1,808 | $44,350 | $4,830 | $39,520 |
| 2022 | $1,809 | $44,350 | $4,830 | $39,520 |
| 2021 | $1,529 | $35,780 | $4,870 | $30,910 |
| 2020 | $1,531 | $35,780 | $4,870 | $30,910 |
| 2019 | $1,530 | $35,780 | $4,870 | $30,910 |
| 2018 | $1,480 | $32,520 | $4,410 | $28,110 |
| 2017 | $1,561 | $32,520 | $4,410 | $28,110 |
| 2016 | $1,559 | $31,820 | $4,060 | $27,760 |
| 2015 | $1,548 | $31,820 | $4,060 | $27,760 |
| 2014 | $1,430 | $31,820 | $4,060 | $27,760 |
Source: Public Records
Map
Nearby Homes
- 306 Imperial Dr
- 3124 Gilson Ave
- 0 Armstrong Ln
- 3170 Hampton Ct
- 316 Carolina Ave
- 3194 Forest Hills Dr
- 3186 Forest Hills Dr
- 3164 Forest Hills Dr
- 3178 Forest Hills Dr
- 140 Huntington Ct
- 3158 Forest Hills Dr
- 0 Kingsridge Rd
- 3150 Forest Hills Dr
- 138 Huntington Ct
- 3177 Forest Hills Dr
- 3173 Forest Hills Dr
- 3165 Forest Hills Dr
- 147 Huntington Ct
- 3135 Forest Hills Dr
- 3140 Forest Hills Dr
- 422 Imperial Dr
- 3015 Meadow Rd
- 3035 Meadow Rd
- 420 Imperial Dr
- 3011 Meadow Rd
- 3045 Meadow Rd
- 3045 Meadow Rd
- 3024 Meadow Rd
- 3014 Meadow Rd
- 429 Imperial Dr
- 421 Imperial Dr Unit RESB
- 3034 Meadow Rd
- 396 Imperial Dr
- 456 Southview Dr
- 3044 Meadow Rd
- 501 Southview Dr
- 468 Southview Dr
- 355 Imperial Dr
- 502 Southview Dr
- 3054 Meadow Rd