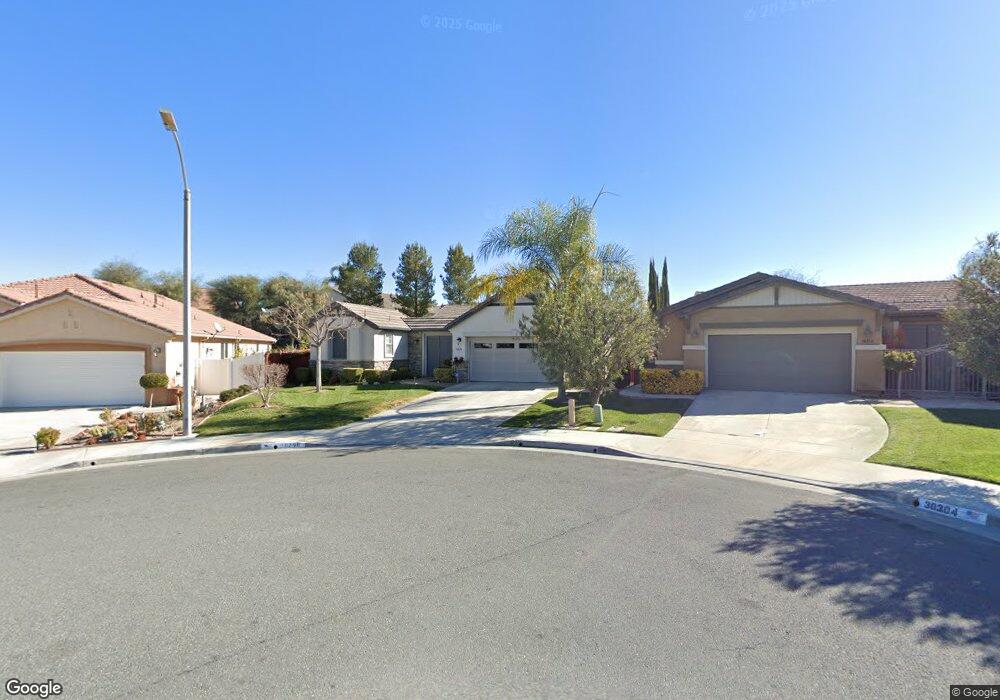
30296 Callaway Cir Murrieta, CA 92563
Winchester-Silverhawk NeighborhoodEstimated Value: $706,000 - $776,000
4
Beds
3
Baths
2,604
Sq Ft
$289/Sq Ft
Est. Value
About This Home
This home is located at 30296 Callaway Cir, Murrieta, CA 92563 and is currently estimated at $751,379, approximately $288 per square foot. 30296 Callaway Cir is a home located in Riverside County with nearby schools including Nicolas Valley Elementary School, James L. Day Middle School, and Chaparral High School.
Ownership History
Date
Name
Owned For
Owner Type
Purchase Details
Closed on
Oct 6, 2019
Sold by
Garcia Paul and Garcia Nancy E
Bought by
Garcia Paul and Garcia Nancy E
Current Estimated Value
Purchase Details
Closed on
Nov 24, 2010
Sold by
Rae Christopher G and Garcia Nancy E
Bought by
Garcia Paul and Garcia Nancy E
Purchase Details
Closed on
Oct 19, 2009
Sold by
Bedard Karen
Bought by
Rae Christopher G and Garcia Nancy E
Purchase Details
Closed on
Jul 16, 2009
Sold by
Rae Samuel G
Bought by
Rae Samuel G and 2009 Restated & Amended Samuel G Rae Tru
Purchase Details
Closed on
Dec 16, 2003
Sold by
Alexander William R and Alexander Susan
Bought by
Rae Samuel G and Rae Marian H
Purchase Details
Closed on
Nov 27, 2000
Sold by
K Hovnanian At Four Seasons Llc
Bought by
Alexander William R and Alexander Susan
Home Financials for this Owner
Home Financials are based on the most recent Mortgage that was taken out on this home.
Original Mortgage
$165,000
Interest Rate
6.98%
Create a Home Valuation Report for This Property
The Home Valuation Report is an in-depth analysis detailing your home's value as well as a comparison with similar homes in the area
Home Values in the Area
Average Home Value in this Area
Purchase History
| Date | Buyer | Sale Price | Title Company |
|---|---|---|---|
| Garcia Paul | -- | None Available | |
| Garcia Paul | $185,000 | First American Title Company | |
| Rae Christopher G | -- | None Available | |
| Rae Samuel G | -- | None Available | |
| Rae Samuel G | $436,000 | First American Title Co | |
| Alexander William R | $252,500 | Lawyers Title Company |
Source: Public Records
Mortgage History
| Date | Status | Borrower | Loan Amount |
|---|---|---|---|
| Previous Owner | Alexander William R | $165,000 |
Source: Public Records
Tax History Compared to Growth
Tax History
| Year | Tax Paid | Tax Assessment Tax Assessment Total Assessment is a certain percentage of the fair market value that is determined by local assessors to be the total taxable value of land and additions on the property. | Land | Improvement |
|---|---|---|---|---|
| 2025 | $5,618 | $455,207 | $90,527 | $364,680 |
| 2023 | $5,618 | $437,532 | $87,012 | $350,520 |
| 2022 | $8,776 | $428,954 | $85,306 | $343,648 |
| 2021 | $8,677 | $420,544 | $83,634 | $336,910 |
| 2020 | $8,580 | $416,233 | $82,777 | $333,456 |
| 2019 | $8,505 | $408,072 | $81,154 | $326,918 |
| 2018 | $8,408 | $400,071 | $79,564 | $320,507 |
| 2017 | $8,300 | $392,227 | $78,004 | $314,223 |
| 2016 | $8,203 | $384,537 | $76,475 | $308,062 |
| 2015 | $8,166 | $378,763 | $75,327 | $303,436 |
| 2014 | $8,025 | $371,345 | $73,852 | $297,493 |
Source: Public Records
Map
Nearby Homes
- 39646 Freemark Abbey
- 39584 Cardiff Ave
- 27478 Sierra Madre Dr
- 39555 Freemark Abbey
- 39557 Warbler Dr
- 40087 Cannes Ct
- 40112 Adian Ct
- 30069 Milano Rd
- 39463 Napa Creek Dr
- 39483 Almaden Cir
- 30472 Bogart Place
- 30276 Via Val Verde
- 30478 Sierra Madre Dr
- 30511 Bogart Place
- 29928 Valle Olvera
- 40219 Donomore Ct
- 40221 Paseo Sereno
- 40224 Holden Cir
- 40230 Holden Cir
- 39883 S Creek Cir
- 30304 Callaway Cir
- 30288 Callaway Cir
- 39679 Clos du Val
- 39687 Clos du Val
- 39651 Freemark Abbey
- 39635 Freemark Abbey
- 30280 Callaway Cir
- 39671 Clos du Val
- 39695 Clos du Val
- 30301 Callaway Cir
- 39627 Freemark Abbey
- 39663 Clos du Val
- 30272 Callaway Cir
- 39703 Clos du Val
- 30293 Callaway Cir
- 30285 Callaway Cir
- 39619 Freemark Abbey
- 39655 Clos du Val
- 30277 Callaway Cir
- 39654 Freemark Abbey