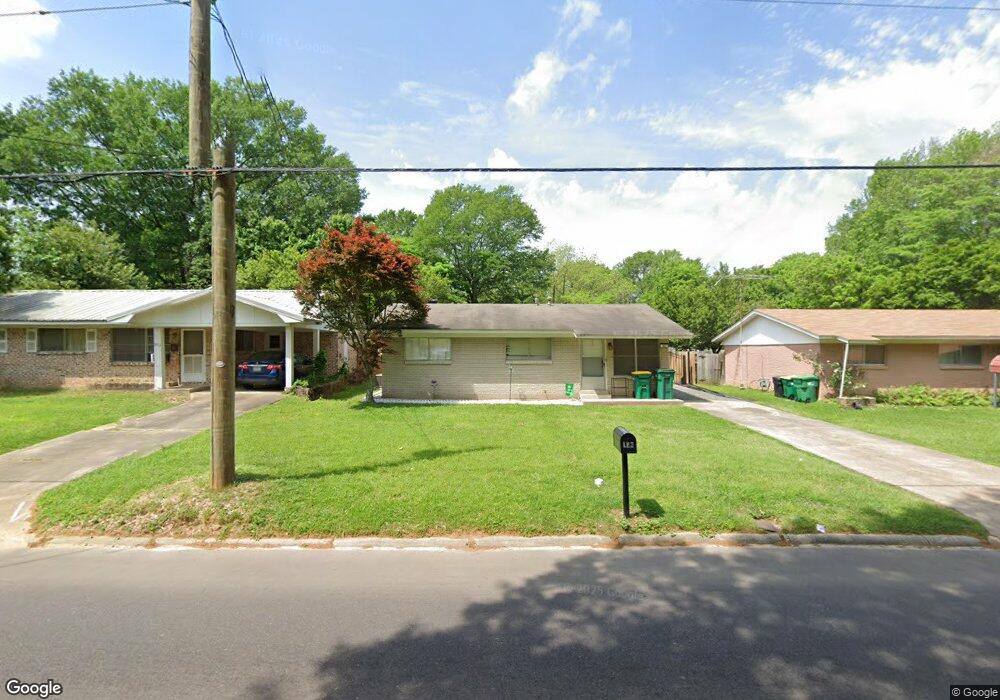
303 Belt Rd Texarkana, TX 75501
Estimated Value: $123,000 - $173,000
--
Bed
--
Bath
1,719
Sq Ft
$83/Sq Ft
Est. Value
About This Home
This home is located at 303 Belt Rd, Texarkana, TX 75501 and is currently estimated at $142,743, approximately $83 per square foot. 303 Belt Rd is a home located in Bowie County with nearby schools including Westlawn Elementary School, Theron Jones Early Literacy Center, and Texas Middle School.
Ownership History
Date
Name
Owned For
Owner Type
Purchase Details
Closed on
Oct 24, 2022
Sold by
Bennett Lee Debra Kaye
Bought by
Lee Jeremy K and Lee Byron K
Current Estimated Value
Home Financials for this Owner
Home Financials are based on the most recent Mortgage that was taken out on this home.
Original Mortgage
$110,200
Outstanding Balance
$106,508
Interest Rate
6.7%
Mortgage Type
New Conventional
Estimated Equity
$36,235
Create a Home Valuation Report for This Property
The Home Valuation Report is an in-depth analysis detailing your home's value as well as a comparison with similar homes in the area
Home Values in the Area
Average Home Value in this Area
Purchase History
| Date | Buyer | Sale Price | Title Company |
|---|---|---|---|
| Lee Jeremy K | -- | -- |
Source: Public Records
Mortgage History
| Date | Status | Borrower | Loan Amount |
|---|---|---|---|
| Open | Lee Jeremy K | $110,200 |
Source: Public Records
Tax History Compared to Growth
Tax History
| Year | Tax Paid | Tax Assessment Tax Assessment Total Assessment is a certain percentage of the fair market value that is determined by local assessors to be the total taxable value of land and additions on the property. | Land | Improvement |
|---|---|---|---|---|
| 2025 | $2,283 | $131,520 | $10,000 | $121,520 |
| 2024 | $2,283 | $124,069 | $10,000 | $114,069 |
| 2023 | $2,790 | $117,833 | $10,000 | $107,833 |
| 2022 | $2,391 | $100,165 | $8,500 | $91,665 |
| 2021 | $2,162 | $84,567 | $8,500 | $76,067 |
| 2020 | $2,083 | $81,030 | $8,500 | $72,530 |
| 2019 | $2,072 | $77,667 | $8,500 | $69,167 |
| 2018 | $2,055 | $77,022 | $8,500 | $68,522 |
| 2017 | $2,015 | $75,735 | $8,500 | $67,235 |
| 2016 | $2,015 | $75,735 | $8,500 | $67,235 |
| 2015 | $796 | $75,099 | $8,500 | $66,599 |
| 2014 | $796 | $72,651 | $8,500 | $64,151 |
Source: Public Records
Map
Nearby Homes
- 3106 Meadows Dr
- 3303 New Boston Rd
- 202 S Kenwood Rd
- 2211 N Akin Ave
- 2901 Marion St
- 0 Belt Rd Unit 118684
- 0 Meadowbrook Ln
- TBD N Kenwood Rd
- 500 Wade Ln
- 210 Cheyenne Place
- 207 Wildwood Dr
- 2704 Charlotte St
- 1703 Liddell St
- 322 Brookwood Dr
- 203 Madison Dr
- 3508 N Robison Rd
- 1406 Richmond Rd
- 2311 New Boston Rd
- 1609 Plum St
- 1010 Richmond Rd