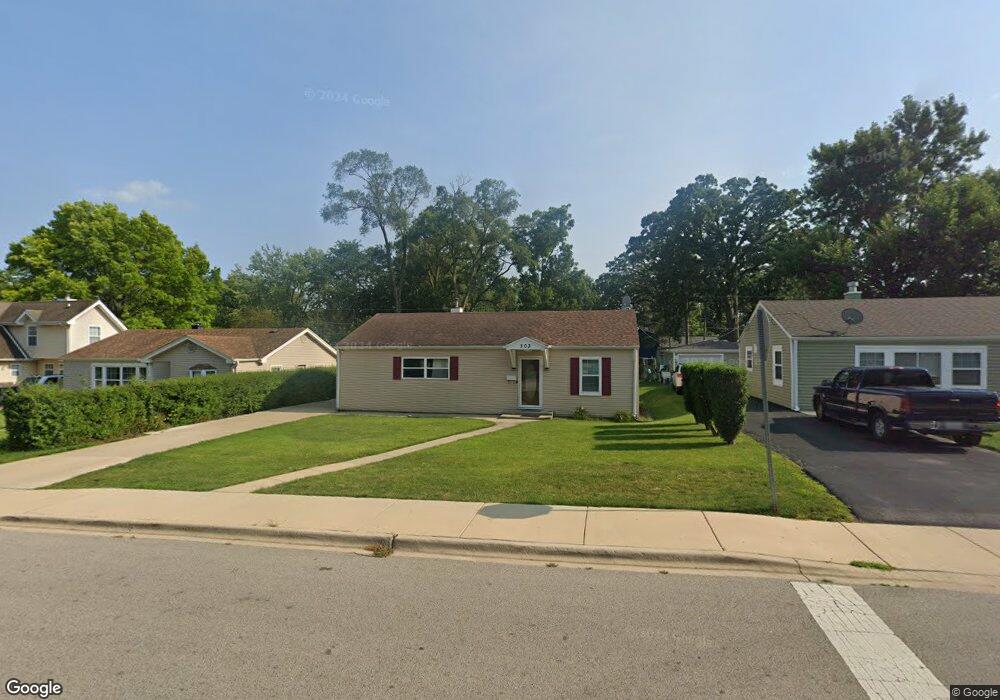
303 E Hawthorne Blvd Mundelein, IL 60060
Estimated Value: $230,500 - $267,000
--
Bed
1
Bath
1,050
Sq Ft
$235/Sq Ft
Est. Value
About This Home
This home is located at 303 E Hawthorne Blvd, Mundelein, IL 60060 and is currently estimated at $247,125, approximately $235 per square foot. 303 E Hawthorne Blvd is a home located in Lake County with nearby schools including Washington Early Learning Center, Mechanics Grove Elementary School, and Carl Sandburg Middle School.
Ownership History
Date
Name
Owned For
Owner Type
Purchase Details
Closed on
Jun 20, 2005
Sold by
Ruiz Refugio G and Ruiz Ana R
Bought by
Garcia Felipe J and Gutierrez Eliselda
Current Estimated Value
Home Financials for this Owner
Home Financials are based on the most recent Mortgage that was taken out on this home.
Original Mortgage
$147,920
Outstanding Balance
$85,654
Interest Rate
7.5%
Mortgage Type
Purchase Money Mortgage
Estimated Equity
$161,471
Purchase Details
Closed on
Dec 27, 2000
Sold by
Lesofsky Geraldine G and Andrews Linda J
Bought by
Ruiz Refugio G and Ruiz Refugio G
Home Financials for this Owner
Home Financials are based on the most recent Mortgage that was taken out on this home.
Original Mortgage
$111,281
Interest Rate
7.69%
Mortgage Type
FHA
Purchase Details
Closed on
Nov 24, 1995
Sold by
Lesofsky Geraldine G
Bought by
Lesofsky Geraldine G and Andrews Linda J
Create a Home Valuation Report for This Property
The Home Valuation Report is an in-depth analysis detailing your home's value as well as a comparison with similar homes in the area
Home Values in the Area
Average Home Value in this Area
Purchase History
| Date | Buyer | Sale Price | Title Company |
|---|---|---|---|
| Garcia Felipe J | $185,000 | Professional National Title | |
| Ruiz Refugio G | $112,000 | Premier Title | |
| Lesofsky Geraldine G | -- | -- |
Source: Public Records
Mortgage History
| Date | Status | Borrower | Loan Amount |
|---|---|---|---|
| Open | Garcia Felipe J | $147,920 | |
| Previous Owner | Ruiz Refugio G | $111,281 |
Source: Public Records
Tax History Compared to Growth
Tax History
| Year | Tax Paid | Tax Assessment Tax Assessment Total Assessment is a certain percentage of the fair market value that is determined by local assessors to be the total taxable value of land and additions on the property. | Land | Improvement |
|---|---|---|---|---|
| 2024 | $4,991 | $61,964 | $18,875 | $43,089 |
| 2023 | $4,497 | $55,487 | $16,902 | $38,585 |
| 2022 | $4,497 | $48,250 | $16,246 | $32,004 |
| 2021 | $4,359 | $47,211 | $15,896 | $31,315 |
| 2020 | $4,094 | $44,208 | $14,885 | $29,323 |
| 2019 | $3,637 | $39,807 | $13,403 | $26,404 |
| 2018 | $3,077 | $34,683 | $10,772 | $23,911 |
| 2017 | $3,031 | $33,588 | $10,432 | $23,156 |
| 2016 | $2,923 | $31,846 | $9,891 | $21,955 |
| 2015 | $2,810 | $29,766 | $9,245 | $20,521 |
| 2014 | $2,822 | $29,367 | $9,121 | $20,246 |
| 2012 | $3,481 | $37,030 | $11,501 | $25,529 |
Source: Public Records
Map
Nearby Homes
- 433 E High St
- 425 S Lake St
- 510 S Hickory St
- 18 S Hawthorne Blvd
- 114 W Hawthorne Blvd
- 40 S Seymour Ave
- 228 Woodlawn Dr
- 701 Thomas Ct
- 130 Shadydell Ave
- 640 Allanson Rd
- 29746 U S 45
- 49 N Shaddle Ave
- 116 N Prairie Ave
- 51 S Pershing Ave
- 116 S Pershing Ave
- 331 Plaza Cir
- 261 N Shaddle Ave
- 31 Washington Blvd Unit 108
- 841 Wilcox St
- 207 Shady Ln
- 309 E Hawthorne Blvd
- 227 E Hawthorne Blvd
- 210 S Midland Ave
- 221 E Hawthorne Blvd
- 310 Grove St
- 242 Grove St
- 318 Grove St
- 215 E Hawthorne Blvd
- 234 Grove St
- 228 E Hawthorne Blvd
- 226 Grove St
- 209 E Hawthorne Blvd
- 333 E High St
- 222 E Hawthorne Blvd
- 310 E Hawthorne Blvd
- 216 E Hawthorne Blvd
- 334 Grove St
- 203 E Hawthorne Blvd
- 218 Grove St
- 341 E High St