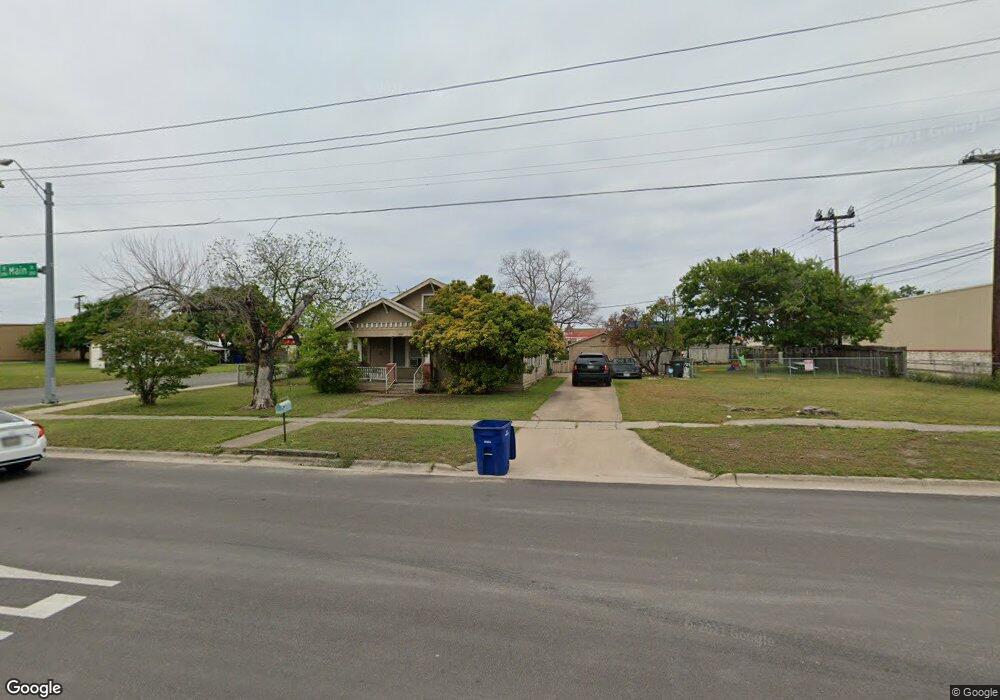
303 N Main St Copperas Cove, TX 76522
Estimated Value: $161,223 - $167,000
3
Beds
1
Bath
1,404
Sq Ft
$117/Sq Ft
Est. Value
About This Home
This home is located at 303 N Main St, Copperas Cove, TX 76522 and is currently estimated at $164,112, approximately $116 per square foot. 303 N Main St is a home located in Coryell County with nearby schools including Hettie Halstead Elementary School, S.C. Lee Junior High School, and Copperas Cove High School.
Ownership History
Date
Name
Owned For
Owner Type
Purchase Details
Closed on
Aug 15, 2022
Sold by
Judd Delbert R and Judd Karrie L
Bought by
Abbasi Ashfaq
Current Estimated Value
Home Financials for this Owner
Home Financials are based on the most recent Mortgage that was taken out on this home.
Original Mortgage
$264,000
Outstanding Balance
$252,397
Interest Rate
5.51%
Mortgage Type
New Conventional
Estimated Equity
-$88,285
Purchase Details
Closed on
Mar 5, 2020
Sold by
Sj Ranch Llc
Bought by
Slap Properties Llc
Purchase Details
Closed on
Dec 6, 2019
Sold by
Wulfkuhle Jacob
Bought by
Sj Ranch Llc
Purchase Details
Closed on
Aug 26, 2008
Sold by
Stephens Vernell V and Renfro Roberta C
Bought by
Judd Delbert R and Judd Karrie L
Create a Home Valuation Report for This Property
The Home Valuation Report is an in-depth analysis detailing your home's value as well as a comparison with similar homes in the area
Home Values in the Area
Average Home Value in this Area
Purchase History
| Date | Buyer | Sale Price | Title Company |
|---|---|---|---|
| Abbasi Ashfaq | -- | None Listed On Document | |
| Slap Properties Llc | -- | None Available | |
| Sj Ranch Llc | -- | None Available | |
| Judd Delbert R | -- | -- |
Source: Public Records
Mortgage History
| Date | Status | Borrower | Loan Amount |
|---|---|---|---|
| Open | Abbasi Ashfaq | $264,000 |
Source: Public Records
Tax History Compared to Growth
Tax History
| Year | Tax Paid | Tax Assessment Tax Assessment Total Assessment is a certain percentage of the fair market value that is determined by local assessors to be the total taxable value of land and additions on the property. | Land | Improvement |
|---|---|---|---|---|
| 2025 | $3,172 | $155,370 | $40,000 | $115,370 |
| 2024 | $3,172 | $160,090 | $40,000 | $120,090 |
| 2023 | $3,172 | $147,110 | $30,000 | $117,110 |
| 2022 | $1,374 | $61,225 | $30,000 | $31,225 |
| 2021 | $1,449 | $56,225 | $25,000 | $31,225 |
| 2020 | $1,472 | $56,225 | $20,000 | $36,225 |
| 2019 | $1,491 | $55,000 | $20,000 | $35,000 |
| 2018 | $1,445 | $53,250 | $20,000 | $33,250 |
| 2017 | $1,269 | $47,720 | $20,000 | $27,720 |
| 2016 | $1,196 | $44,970 | $17,250 | $27,720 |
| 2015 | $1,856 | $45,270 | $17,250 | $28,020 |
| 2014 | $1,856 | $70,990 | $17,250 | $53,740 |
Source: Public Records
Map
Nearby Homes
- 405 N Main St
- 502 N Main St
- FM 1113 W Lindorbet Ranch Lot 16a
- 103 Logan Ct
- 346 Monty Rd
- 342 Monty Rd
- 374 Pathfinder Dr
- 127 Cameron Dr
- 334 Monty Rd
- 560 Cr 4808
- 412 W Avenue C
- 414 W Avenue C
- 408 W Avenue C
- 206 E Washington Ave
- 201 S 2nd St
- 101 North Dr
- 303 E Avenue A
- 310 W Avenue A
- 305 E Avenue A Unit 305
- 190 E Us Hwy
- 305 N Main St
- 309 N Main St
- 207 N Main St
- Lot 1 Blk 1 Town Square
- 1 Blk 1 Town Square
- 1723 Lubbock Dr
- 101 W Avenue B
- 307 N Main St
- 205 N Main St
- 103 W Avenue A
- 102 E Avenue A
- 208 N Main St
- 105 W Avenue A
- 302 N 1st St
- 204 N Main St
- 105 E Avenue B
- 109 W Avenue A
- 203 N Main St
- 201 N Main St
- 202 N Main St