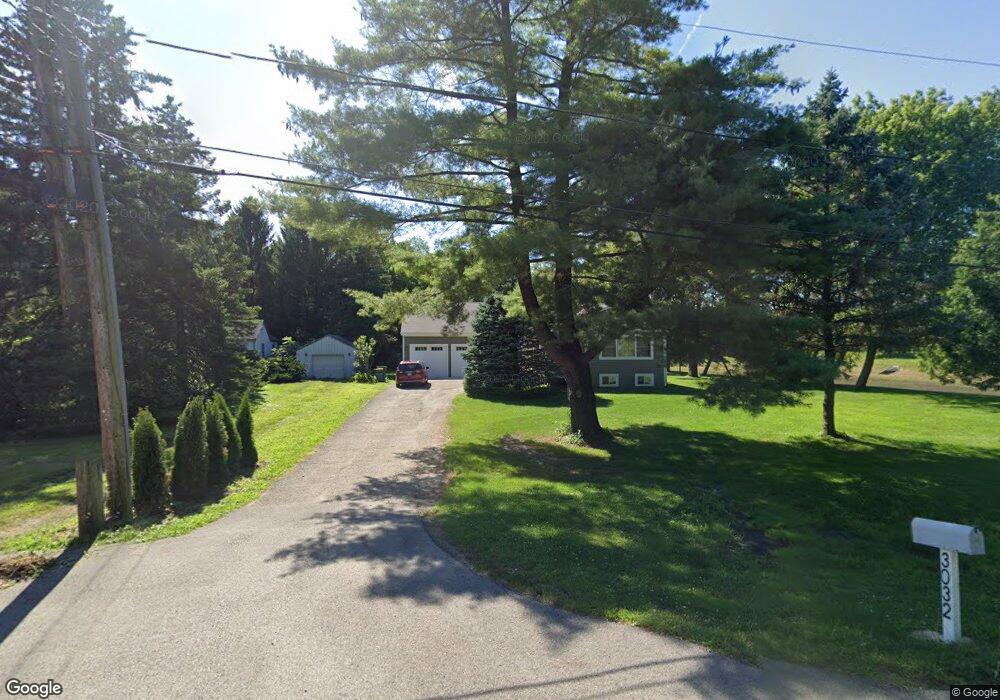
3032 Jackson Dr Arlington Heights, IL 60004
Estimated Value: $409,000 - $433,071
3
Beds
1
Bath
1,632
Sq Ft
$256/Sq Ft
Est. Value
About This Home
This home is located at 3032 Jackson Dr, Arlington Heights, IL 60004 and is currently estimated at $418,268, approximately $256 per square foot. 3032 Jackson Dr is a home located in Cook County with nearby schools including Booth Tarkington Elementary School, Jack London Middle School, and Wheeling High School.
Ownership History
Date
Name
Owned For
Owner Type
Purchase Details
Closed on
Apr 4, 2003
Sold by
Franz Michael
Bought by
Franz Michael and Franz Kathleen D
Current Estimated Value
Home Financials for this Owner
Home Financials are based on the most recent Mortgage that was taken out on this home.
Original Mortgage
$191,985
Interest Rate
6.02%
Mortgage Type
Unknown
Purchase Details
Closed on
Mar 13, 2002
Sold by
Franz Michael and Franz Michael
Bought by
Franz Michael
Home Financials for this Owner
Home Financials are based on the most recent Mortgage that was taken out on this home.
Original Mortgage
$192,000
Interest Rate
6.87%
Purchase Details
Closed on
Sep 24, 2001
Sold by
Lasalle Bank National Assn
Bought by
Franz Michael and Franz Michael J
Home Financials for this Owner
Home Financials are based on the most recent Mortgage that was taken out on this home.
Original Mortgage
$164,000
Interest Rate
6.97%
Create a Home Valuation Report for This Property
The Home Valuation Report is an in-depth analysis detailing your home's value as well as a comparison with similar homes in the area
Home Values in the Area
Average Home Value in this Area
Purchase History
| Date | Buyer | Sale Price | Title Company |
|---|---|---|---|
| Franz Michael | -- | 1St American Title | |
| Franz Michael | -- | 1St American Title | |
| Franz Michael | -- | 1St American Title | |
| Franz Michael | $205,000 | -- |
Source: Public Records
Mortgage History
| Date | Status | Borrower | Loan Amount |
|---|---|---|---|
| Closed | Franz Michael | $191,985 | |
| Closed | Franz Michael | $192,000 | |
| Closed | Franz Michael | $164,000 |
Source: Public Records
Tax History Compared to Growth
Tax History
| Year | Tax Paid | Tax Assessment Tax Assessment Total Assessment is a certain percentage of the fair market value that is determined by local assessors to be the total taxable value of land and additions on the property. | Land | Improvement |
|---|---|---|---|---|
| 2024 | $8,608 | $31,016 | $9,154 | $21,862 |
| 2023 | $8,175 | $31,016 | $9,154 | $21,862 |
| 2022 | $8,175 | $31,016 | $9,154 | $21,862 |
| 2021 | $8,706 | $26,827 | $8,137 | $18,690 |
| 2020 | $8,561 | $26,827 | $8,137 | $18,690 |
| 2019 | $8,644 | $29,808 | $8,137 | $21,671 |
| 2018 | $7,896 | $25,071 | $7,119 | $17,952 |
| 2017 | $7,756 | $25,071 | $7,119 | $17,952 |
| 2016 | $8,346 | $27,512 | $7,119 | $20,393 |
| 2015 | $7,914 | $24,833 | $6,102 | $18,731 |
| 2014 | $7,756 | $24,833 | $6,102 | $18,731 |
| 2013 | $7,142 | $24,833 | $6,102 | $18,731 |
Source: Public Records
Map
Nearby Homes
- 3026 Jackson Dr
- 1485 Chippewa Trail
- 441 Commanche Trail Unit 3100
- 2822 Jackson Dr
- 528 Surf Ct
- 2812 Jackson Dr
- 671 Cedarwood Ct Unit 2
- 691 Lakeside Circle Dr
- 705 Lakeside Circle Dr Unit 2
- 1088 Captains Ln
- 1637 Tahoe Circle Dr Unit 209
- 791 Lakeside Circle Dr Unit 1
- 314 Anthony Rd
- 413 Buffalo Trail Unit 10601
- 200 Lake Blvd Unit 439
- 175 Lake Blvd Unit 301
- 416 Trinity Ct
- 52 Schoenbeck Rd
- 963 S Fletcher Dr
- 150 Lake Blvd Unit 125
- 2940 Jackson Dr
- 3020 Jackson Dr
- 3033 Jackson Dr
- 3111 Jackson Dr
- 3027 Jackson Dr
- 3014 Jackson Dr
- 3021 Jackson Dr
- 1482 Chippewa Trail Unit 1
- 1480 Chippewa Trail
- 1484 Chippewa Trail
- 1478 Chippewa Trail Unit 1
- 1486 Chippewa Trail Unit 1
- 1476 Chippewa Trail
- 1488 Chippewa Trail Unit 1
- 1474 Chippewa Trail
- 1490 Chippewa Trail
- 3015 Jackson Dr
- 1472 Chippewa Trail
- 2940 Jackson Dr
- 3121 Jackson Dr