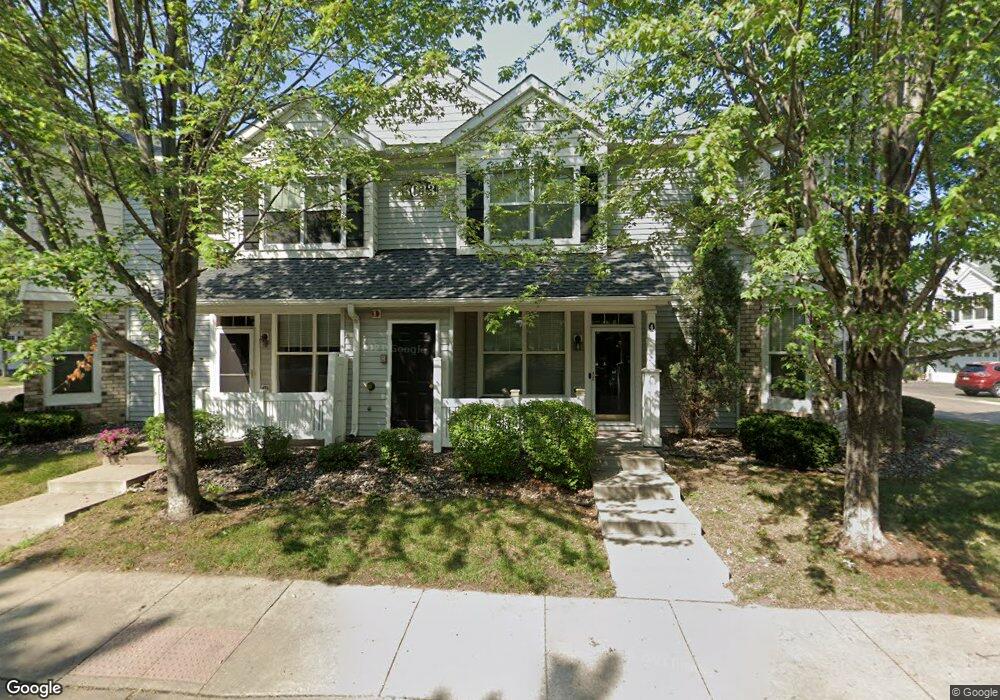
3033 Chamberlin St N Unit 8 Saint Paul, MN 55109
Hazelwood NeighborhoodEstimated Value: $290,248 - $294,000
3
Beds
3
Baths
1,741
Sq Ft
$167/Sq Ft
Est. Value
About This Home
This home is located at 3033 Chamberlin St N Unit 8, Saint Paul, MN 55109 and is currently estimated at $291,562, approximately $167 per square foot. 3033 Chamberlin St N Unit 8 is a home located in Ramsey County with nearby schools including Richardson Elementary School, John Glenn Middle School, and AFSA K-12 Public Charter School.
Ownership History
Date
Name
Owned For
Owner Type
Purchase Details
Closed on
Jun 28, 2024
Sold by
Martel Florent and Geigle Julia C
Bought by
Jigissa Muluembet
Current Estimated Value
Home Financials for this Owner
Home Financials are based on the most recent Mortgage that was taken out on this home.
Original Mortgage
$156,000
Outstanding Balance
$154,137
Interest Rate
6.99%
Mortgage Type
Credit Line Revolving
Estimated Equity
$137,425
Purchase Details
Closed on
Apr 27, 2023
Sold by
Geigle Julia C and Geigle Florent
Bought by
Geigle Julia C and Martel Florent
Purchase Details
Closed on
Jun 13, 2016
Sold by
Kramer Thomas R and Kramer Lois A
Bought by
Geigle Julia C
Home Financials for this Owner
Home Financials are based on the most recent Mortgage that was taken out on this home.
Original Mortgage
$175,655
Interest Rate
2.25%
Mortgage Type
Adjustable Rate Mortgage/ARM
Create a Home Valuation Report for This Property
The Home Valuation Report is an in-depth analysis detailing your home's value as well as a comparison with similar homes in the area
Home Values in the Area
Average Home Value in this Area
Purchase History
| Date | Buyer | Sale Price | Title Company |
|---|---|---|---|
| Jigissa Muluembet | $296,000 | Servion Title | |
| Geigle Julia C | $500 | None Listed On Document | |
| Geigle Julia C | $184,900 | Gibraltar Title |
Source: Public Records
Mortgage History
| Date | Status | Borrower | Loan Amount |
|---|---|---|---|
| Open | Jigissa Muluembet | $156,000 | |
| Previous Owner | Geigle Julia C | $175,655 |
Source: Public Records
Tax History Compared to Growth
Tax History
| Year | Tax Paid | Tax Assessment Tax Assessment Total Assessment is a certain percentage of the fair market value that is determined by local assessors to be the total taxable value of land and additions on the property. | Land | Improvement |
|---|---|---|---|---|
| 2025 | $3,864 | $267,100 | $50,000 | $217,100 |
| 2023 | $3,864 | $281,300 | $50,000 | $231,300 |
| 2022 | $3,152 | $285,700 | $50,000 | $235,700 |
| 2021 | $2,936 | $224,600 | $50,000 | $174,600 |
| 2020 | $3,082 | $215,300 | $50,000 | $165,300 |
| 2019 | $2,722 | $211,000 | $22,500 | $188,500 |
| 2018 | $2,670 | $192,200 | $22,500 | $169,700 |
| 2017 | $2,382 | $184,500 | $22,500 | $162,000 |
| 2016 | $2,354 | $0 | $0 | $0 |
| 2015 | $1,984 | $160,400 | $24,100 | $136,300 |
| 2014 | $2,202 | $0 | $0 | $0 |
Source: Public Records
Map
Nearby Homes
- 1615 Legacy Pkwy E Unit 1011
- 1617 Legacy Pkwy E Unit 4
- 3029 Hemingway Trail N Unit 2
- 2121 E County Road D
- 1613 County Road D E Unit L
- 1285 County Road D Cir E Unit B
- 1243 Majestic Ave Unit 313
- 3020 Carey Heights Dr
- 1836 Belland Ave
- 1776 Elm St
- 3237 Jerry Ct
- 2065 Woodlynn Ave
- 2554 Bittersweet Ln
- 3561 Rooney Place
- 3571 Rooney Place
- 3580 Rooney Place
- 2112 Radatz Ave
- 998 Kohlman Ct
- 2420 Hazelwood St
- 3644 Linden Ave Unit 11
- 3033 Chamberlin St N Unit 5
- 3033 Chamberlin St N Unit 2
- 3033 Chamberlin St N Unit 1
- 3033 Chamberlin St N Unit 4
- 3033 Chamberlin St N Unit 3
- 3033 Chamberlin St N Unit 6
- 3033 Chamberlin St N Unit 7
- 3033 3033 Chamberlin St N
- 3033 3033 Chamberlain St N
- 3033 Chamberlain St
- 3033 Chamberlain St Unit 8
- 3033 Chamberlain St Unit 4
- 3049 Chamberlin St N Unit 7
- 3049 Chamberlin St N Unit 8
- 3049 Chamberlin St N Unit 5
- 3049 Chamberlin St N Unit 4
- 3049 Chamberlin St N Unit 3
- 3049 Chamberlin St N Unit 6
- 3049 Chamberlin St N Unit 1
- 3049 Chamberlin St N Unit 2