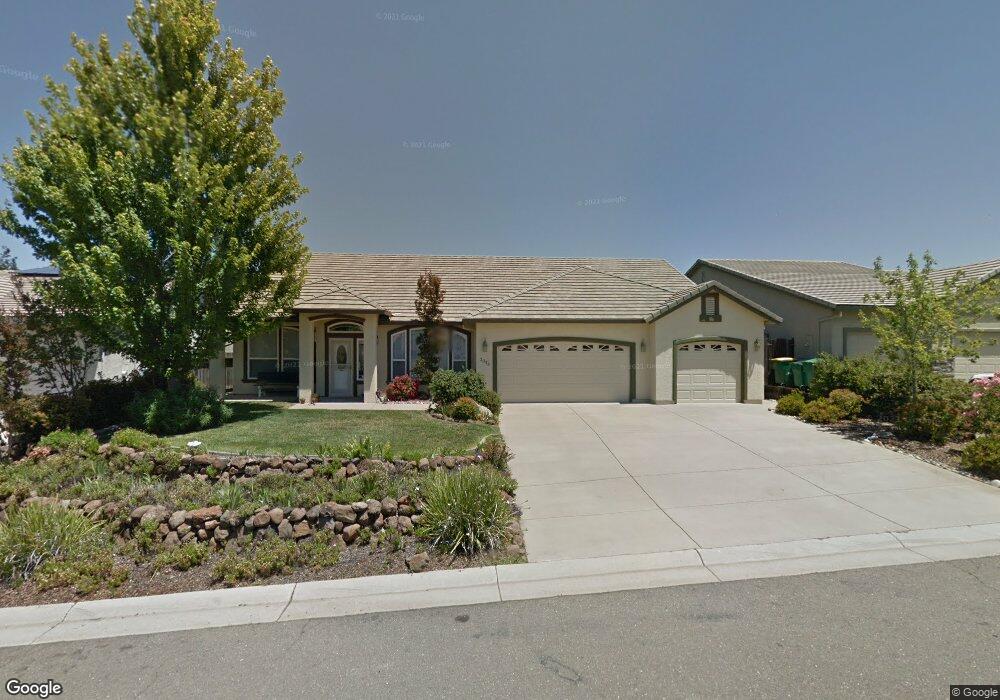
3033 Woodleigh Ln Cameron Park, CA 95682
Estimated Value: $661,000 - $843,000
4
Beds
2
Baths
2,518
Sq Ft
$304/Sq Ft
Est. Value
About This Home
This home is located at 3033 Woodleigh Ln, Cameron Park, CA 95682 and is currently estimated at $765,071, approximately $303 per square foot. 3033 Woodleigh Ln is a home located in El Dorado County with nearby schools including Green Valley Elementary School, Pleasant Grove Middle School, and Ponderosa High School.
Ownership History
Date
Name
Owned For
Owner Type
Purchase Details
Closed on
Jun 9, 2011
Sold by
Dunning Edwin Rex and L Parker Dunning J
Bought by
Dunning Edwin Rex and Dunning Janet
Current Estimated Value
Purchase Details
Closed on
Sep 6, 2001
Sold by
Hsieh George C
Bought by
Hsieh George C and Urban Theodore S
Home Financials for this Owner
Home Financials are based on the most recent Mortgage that was taken out on this home.
Original Mortgage
$100,000
Outstanding Balance
$38,767
Interest Rate
6.91%
Estimated Equity
$726,304
Purchase Details
Closed on
Aug 31, 2001
Sold by
Hsieh George C
Bought by
Dunning Edwin Rex and L Parker Dunning J
Home Financials for this Owner
Home Financials are based on the most recent Mortgage that was taken out on this home.
Original Mortgage
$100,000
Outstanding Balance
$38,767
Interest Rate
6.91%
Estimated Equity
$726,304
Purchase Details
Closed on
Jun 13, 2001
Sold by
Urban Theodore S
Bought by
Hsieh George C
Create a Home Valuation Report for This Property
The Home Valuation Report is an in-depth analysis detailing your home's value as well as a comparison with similar homes in the area
Home Values in the Area
Average Home Value in this Area
Purchase History
| Date | Buyer | Sale Price | Title Company |
|---|---|---|---|
| Dunning Edwin Rex | -- | None Available | |
| Hsieh George C | -- | Placer Title Company | |
| Dunning Edwin Rex | $390,000 | Fidelity National Title Co | |
| Hsieh George C | -- | Placer Title Company |
Source: Public Records
Mortgage History
| Date | Status | Borrower | Loan Amount |
|---|---|---|---|
| Open | Dunning Edwin Rex | $100,000 |
Source: Public Records
Tax History Compared to Growth
Tax History
| Year | Tax Paid | Tax Assessment Tax Assessment Total Assessment is a certain percentage of the fair market value that is determined by local assessors to be the total taxable value of land and additions on the property. | Land | Improvement |
|---|---|---|---|---|
| 2025 | $6,069 | $575,965 | $132,939 | $443,026 |
| 2024 | $6,069 | $564,673 | $130,333 | $434,340 |
| 2023 | $5,958 | $553,602 | $127,778 | $425,824 |
| 2022 | $5,878 | $542,748 | $125,273 | $417,475 |
| 2021 | $5,823 | $532,107 | $122,817 | $409,290 |
| 2020 | $5,729 | $526,652 | $121,558 | $405,094 |
| 2019 | $5,630 | $516,326 | $119,175 | $397,151 |
| 2018 | $5,471 | $506,203 | $116,839 | $389,364 |
| 2017 | $5,368 | $496,279 | $114,549 | $381,730 |
| 2016 | $5,308 | $486,549 | $112,303 | $374,246 |
| 2015 | $5,124 | $479,243 | $110,617 | $368,626 |
| 2014 | $5,124 | $469,857 | $108,451 | $361,406 |
Source: Public Records
Map
Nearby Homes
- 4066 Plateau Cir
- 423 Oeste Ln
- 0 Wilkinson Rd
- 0 Wilkinson Rd
- 3021 Robles Ct
- 2980 Calido Ct
- 3007 Cambridge Rd
- 3039 Estepa Dr Unit 6E
- 3100 Cambridge Rd Unit 3E
- 3180 Woodleigh Ln
- 2780 Hillcrest Dr
- 4004 Prairie Falcon Dr
- 2871 Vista Verde Dr
- 2940 Pasada Rd
- 3133 Cambridge Rd Unit 3
- 2960 Pasada Rd
- 3053 Cambridge Rd
- 3341 Rancho Tierra Ct
- 3271 Woodleigh Ln
- 3218 Cambridge Rd
- 3041 Woodleigh Ln
- 3021 Woodleigh Ln
- 308 Cranbrook Ct
- 316 Cranbrook Ct
- 300 Cranbrook Ct
- 3030 Woodleigh Ln
- 3024 Woodleigh Ln
- 3031 Woodleigh Ln
- 3042 Woodleigh Ln
- 4062 Plateau Cir
- 3018 Woodleigh Ln
- 3052 Woodleigh Ln
- 320 Cranbrook Ct
- 4070 Plateau Cir
- 3617 Ventana Way
- 3611 Ventana Way
- 3617 Ventana Ln
- 309 Cranbrook Ct
- 3625 Ventana Way
- 301 Cranbrook Ct