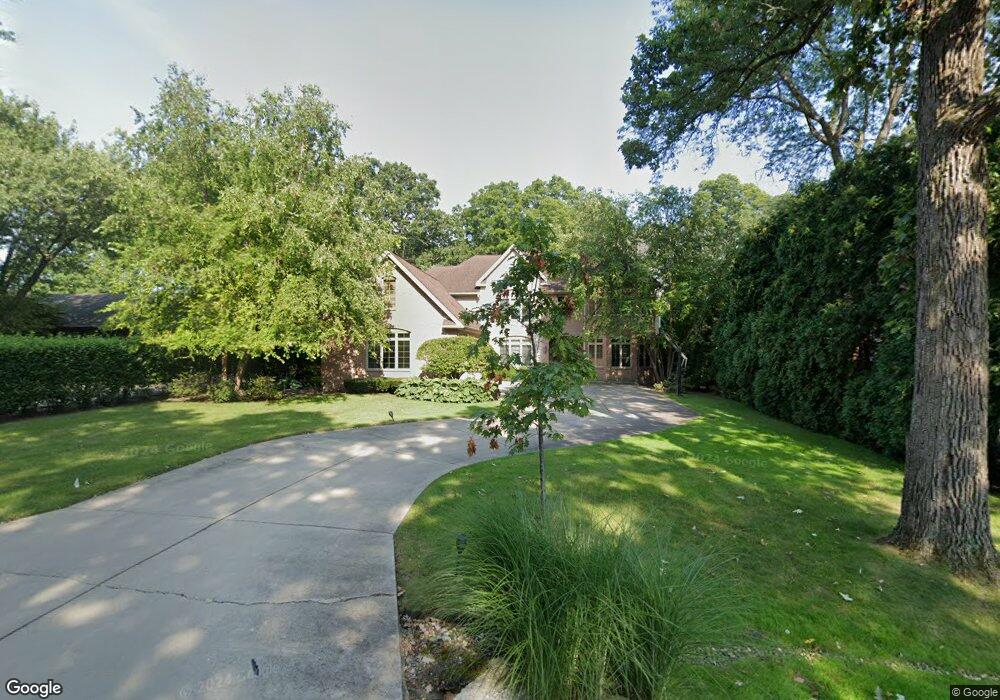
3035 Greenwood Ave Highland Park, IL 60035
West Highland Park NeighborhoodEstimated Value: $974,000 - $1,480,000
4
Beds
5
Baths
3,361
Sq Ft
$357/Sq Ft
Est. Value
About This Home
This home is located at 3035 Greenwood Ave, Highland Park, IL 60035 and is currently estimated at $1,200,215, approximately $357 per square foot. 3035 Greenwood Ave is a home located in Lake County with nearby schools including Wayne Thomas Elementary School, Northwood Jr High School, and Highland Park High School.
Ownership History
Date
Name
Owned For
Owner Type
Purchase Details
Closed on
Dec 30, 2004
Sold by
Arch Pro Llc
Bought by
Kramer Kenneth and Kramer Andrea
Current Estimated Value
Home Financials for this Owner
Home Financials are based on the most recent Mortgage that was taken out on this home.
Original Mortgage
$671,250
Outstanding Balance
$340,695
Interest Rate
5.83%
Mortgage Type
Purchase Money Mortgage
Estimated Equity
$859,520
Purchase Details
Closed on
Jan 15, 2004
Sold by
Nussbaum Beth Renee
Bought by
Archpro Llc
Home Financials for this Owner
Home Financials are based on the most recent Mortgage that was taken out on this home.
Original Mortgage
$265,000
Interest Rate
6.87%
Mortgage Type
Purchase Money Mortgage
Purchase Details
Closed on
Dec 24, 2001
Sold by
Nussbaum Beth R
Bought by
Nussbaum Beth Renee
Home Financials for this Owner
Home Financials are based on the most recent Mortgage that was taken out on this home.
Original Mortgage
$193,500
Interest Rate
5.5%
Create a Home Valuation Report for This Property
The Home Valuation Report is an in-depth analysis detailing your home's value as well as a comparison with similar homes in the area
Home Values in the Area
Average Home Value in this Area
Purchase History
| Date | Buyer | Sale Price | Title Company |
|---|---|---|---|
| Kramer Kenneth | $920,000 | Stewart Title Company | |
| Archpro Llc | $332,000 | Attorneys Title Guaranty Fun | |
| Nussbaum Beth Renee | -- | -- |
Source: Public Records
Mortgage History
| Date | Status | Borrower | Loan Amount |
|---|---|---|---|
| Open | Kramer Kenneth | $671,250 | |
| Previous Owner | Archpro Llc | $265,000 | |
| Previous Owner | Nussbaum Beth Renee | $193,500 | |
| Closed | Kramer Kenneth | $69,750 |
Source: Public Records
Tax History Compared to Growth
Tax History
| Year | Tax Paid | Tax Assessment Tax Assessment Total Assessment is a certain percentage of the fair market value that is determined by local assessors to be the total taxable value of land and additions on the property. | Land | Improvement |
|---|---|---|---|---|
| 2024 | $26,289 | $341,173 | $54,056 | $287,117 |
| 2023 | $24,280 | $307,529 | $48,725 | $258,804 |
| 2022 | $24,280 | $275,468 | $53,527 | $221,941 |
| 2021 | $22,385 | $266,281 | $51,742 | $214,539 |
| 2020 | $21,661 | $266,281 | $51,742 | $214,539 |
| 2019 | $20,931 | $265,035 | $51,500 | $213,535 |
| 2018 | $11,209 | $276,770 | $71,677 | $205,093 |
| 2017 | $20,321 | $275,174 | $71,264 | $203,910 |
| 2016 | $19,594 | $261,971 | $67,845 | $194,126 |
| 2015 | $18,980 | $243,399 | $63,035 | $180,364 |
| 2014 | $20,405 | $255,188 | $51,609 | $203,579 |
| 2012 | $19,843 | $256,677 | $51,910 | $204,767 |
Source: Public Records
Map
Nearby Homes
- 535 Lockard Ln
- 525 Lockard Ln
- 512 Hill St
- 3287 Western Ave
- 239 Sheridan Ave
- 3373 Brook Rd
- 228 Llewellyn Ave
- 221 Burchell Ave
- 738 Lyster Rd Unit 1
- 3504 Dato Ave
- 927 Half Day Rd
- 1210 North Ave
- 2524 Augusta Way
- 1060 Livingston (Lot 5) Ave
- The Classic Plan at Hidden Oak of Highland Park
- The Astoria Plan at Hidden Oak of Highland Park
- The Essex Plan at Hidden Oak of Highland Park
- 1066 Livingston St
- 1064 Livingston (Lot 3) Ave
- 1062 Livingston St
- 3023 Greenwood Ave
- 3047 Greenwood Ave
- 3007 Greenwood Ave
- 3057 Greenwood Ave
- 3020 Warbler Place
- 739 Old Trail Rd
- 3010 Warbler Place
- 3060 Warbler Place
- 729 Old Trail Rd
- 3046 Greenwood Ave
- 3067 Greenwood Ave
- 749 Old Trail Rd
- 3064 Greenwood Ave
- 3070 Warbler Place
- 721 Old Trail Rd
- 3079 Greenwood Ave
- 757 Old Trail Rd
- 3072 Greenwood Ave
- 3000 Warbler Place
- 3080 Warbler Place