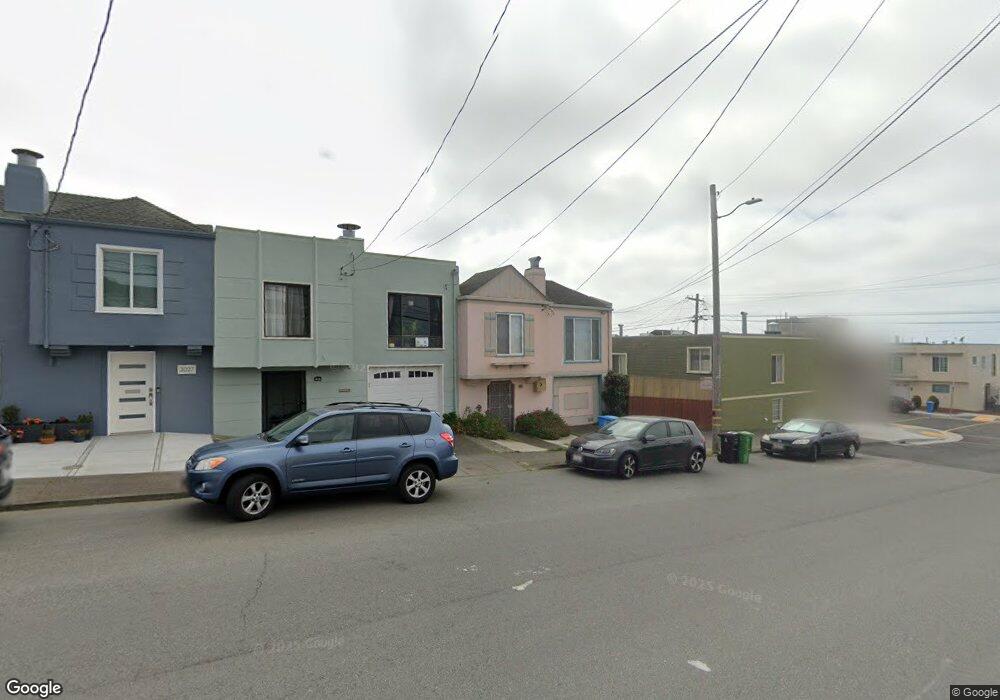
3039 Rivera St San Francisco, CA 94116
Outer Parkside NeighborhoodEstimated Value: $1,174,937 - $1,433,000
--
Bed
1
Bath
1,132
Sq Ft
$1,138/Sq Ft
Est. Value
About This Home
This home is located at 3039 Rivera St, San Francisco, CA 94116 and is currently estimated at $1,288,234, approximately $1,138 per square foot. 3039 Rivera St is a home located in San Francisco County with nearby schools including Sunset Elementary School, Giannini (A.P.) Middle School, and St. Gabriel School.
Ownership History
Date
Name
Owned For
Owner Type
Purchase Details
Closed on
Mar 29, 2001
Sold by
Chau Wong Sun and Chau Ada C
Bought by
Wong Sun Chau and Wong Ada Li
Current Estimated Value
Home Financials for this Owner
Home Financials are based on the most recent Mortgage that was taken out on this home.
Original Mortgage
$275,000
Interest Rate
7.19%
Create a Home Valuation Report for This Property
The Home Valuation Report is an in-depth analysis detailing your home's value as well as a comparison with similar homes in the area
Home Values in the Area
Average Home Value in this Area
Purchase History
| Date | Buyer | Sale Price | Title Company |
|---|---|---|---|
| Wong Sun Chau | -- | Fidelity National Title Co |
Source: Public Records
Mortgage History
| Date | Status | Borrower | Loan Amount |
|---|---|---|---|
| Closed | Wong Sun Chau | $275,000 |
Source: Public Records
Tax History Compared to Growth
Tax History
| Year | Tax Paid | Tax Assessment Tax Assessment Total Assessment is a certain percentage of the fair market value that is determined by local assessors to be the total taxable value of land and additions on the property. | Land | Improvement |
|---|---|---|---|---|
| 2025 | $3,704 | $253,812 | $131,982 | $121,830 |
| 2024 | $3,704 | $248,838 | $129,396 | $119,442 |
| 2023 | $3,639 | $243,960 | $126,860 | $117,100 |
| 2022 | $3,554 | $239,178 | $124,374 | $114,804 |
| 2021 | $3,487 | $234,490 | $121,936 | $112,554 |
| 2020 | $3,572 | $232,086 | $120,686 | $111,400 |
| 2019 | $3,406 | $227,536 | $118,320 | $109,216 |
| 2018 | $3,293 | $223,076 | $116,000 | $107,076 |
| 2017 | $2,956 | $218,704 | $113,726 | $104,978 |
| 2016 | $2,880 | $214,418 | $111,498 | $102,920 |
| 2015 | $2,843 | $211,200 | $109,824 | $101,376 |
| 2014 | $2,770 | $207,066 | $107,674 | $99,392 |
Source: Public Records
Map
Nearby Homes