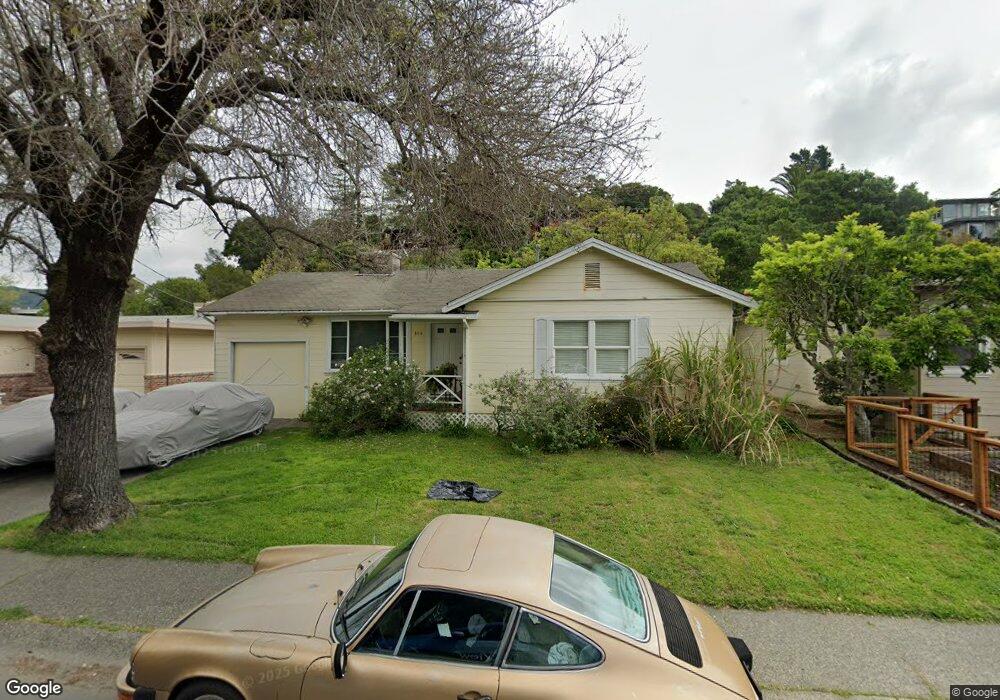
304 Du Bois St San Rafael, CA 94901
Picnic Valley NeighborhoodEstimated Value: $899,000 - $997,000
3
Beds
2
Baths
1,314
Sq Ft
$731/Sq Ft
Est. Value
About This Home
This home is located at 304 Du Bois St, San Rafael, CA 94901 and is currently estimated at $960,891, approximately $731 per square foot. 304 Du Bois St is a home located in Marin County with nearby schools including Laurel Dell Elementary School, Coleman Elementary School, and James B. Davidson Middle School.
Ownership History
Date
Name
Owned For
Owner Type
Purchase Details
Closed on
Apr 1, 2002
Sold by
Woo Dean
Bought by
Woo Evelyn
Current Estimated Value
Home Financials for this Owner
Home Financials are based on the most recent Mortgage that was taken out on this home.
Original Mortgage
$204,000
Outstanding Balance
$84,929
Interest Rate
6.87%
Estimated Equity
$875,962
Purchase Details
Closed on
Apr 29, 1996
Sold by
Higginbotham Dorcas
Bought by
Burkhard Kenneth R
Home Financials for this Owner
Home Financials are based on the most recent Mortgage that was taken out on this home.
Original Mortgage
$172,000
Interest Rate
7.82%
Mortgage Type
Balloon
Purchase Details
Closed on
Aug 19, 1994
Sold by
Budar Nancy T and Budar C
Bought by
Higginbotham Dorcas
Home Financials for this Owner
Home Financials are based on the most recent Mortgage that was taken out on this home.
Original Mortgage
$168,000
Interest Rate
8.73%
Create a Home Valuation Report for This Property
The Home Valuation Report is an in-depth analysis detailing your home's value as well as a comparison with similar homes in the area
Home Values in the Area
Average Home Value in this Area
Purchase History
| Date | Buyer | Sale Price | Title Company |
|---|---|---|---|
| Woo Evelyn | -- | Fidelity National Title | |
| Wood Evelyn | -- | Fidelity National Title | |
| Burkhard Kenneth R | $282,000 | First American Title Co | |
| Higginbotham Dorcas | $210,000 | -- |
Source: Public Records
Mortgage History
| Date | Status | Borrower | Loan Amount |
|---|---|---|---|
| Open | Woo Evelyn | $204,000 | |
| Closed | Burkhard Kenneth R | $172,000 | |
| Previous Owner | Higginbotham Dorcas | $168,000 |
Source: Public Records
Tax History Compared to Growth
Tax History
| Year | Tax Paid | Tax Assessment Tax Assessment Total Assessment is a certain percentage of the fair market value that is determined by local assessors to be the total taxable value of land and additions on the property. | Land | Improvement |
|---|---|---|---|---|
| 2025 | $7,542 | $465,115 | $216,488 | $248,627 |
| 2024 | $7,542 | $455,996 | $212,243 | $243,753 |
| 2023 | $7,364 | $447,055 | $208,082 | $238,973 |
| 2022 | $7,002 | $438,292 | $204,003 | $234,289 |
| 2021 | $6,893 | $429,698 | $200,003 | $229,695 |
| 2020 | $6,794 | $425,294 | $197,953 | $227,341 |
| 2019 | $6,532 | $416,956 | $194,072 | $222,884 |
| 2018 | $6,464 | $408,783 | $190,268 | $218,515 |
| 2017 | $6,237 | $400,769 | $186,538 | $214,231 |
| 2016 | $6,017 | $392,912 | $182,881 | $210,031 |
| 2015 | $5,755 | $387,012 | $180,135 | $206,877 |
| 2014 | $5,502 | $379,433 | $176,607 | $202,826 |
Source: Public Records
Map
Nearby Homes
- 4 Meadow Ave
- 10 Hazel Ct
- 148 Auburn St
- 142 Bungalow Ave
- 150 Bungalow Ave
- 19 Mliss Ln
- 490 Canal St Unit 6
- 56 Mooring Rd Unit 2
- 321 N Almenar Dr
- 124 Tiburon Blvd
- 4 Point San Pedro Rd Unit 4
- 215 Picnic Ave
- 370 Via la Cumbre
- 102 Marina Court Dr
- 81 Corte Gracitas
- 21 Marina Blvd
- 2 Alvina Ave
- 35 Fairfax St Unit 8
- 199 Canal St Unit 6
- 236 C St