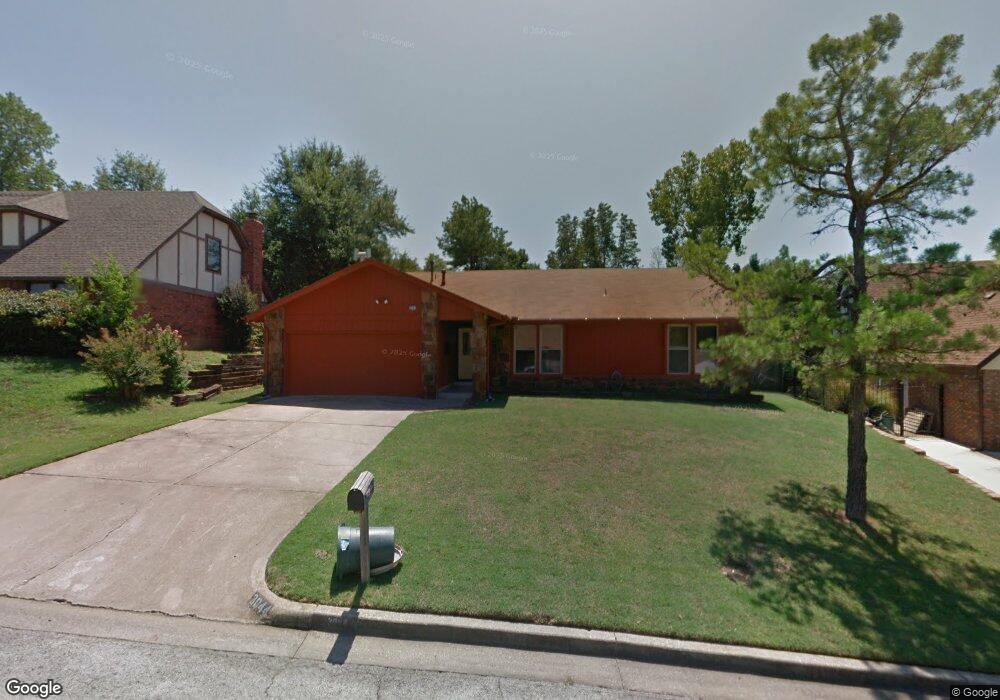
3044 W 69th Place Tulsa, OK 74132
West Highlands-Tulsa Hills NeighborhoodEstimated Value: $240,000 - $282,000
4
Beds
2
Baths
1,948
Sq Ft
$132/Sq Ft
Est. Value
About This Home
This home is located at 3044 W 69th Place, Tulsa, OK 74132 and is currently estimated at $256,481, approximately $131 per square foot. 3044 W 69th Place is a home located in Tulsa County with nearby schools including Jenks Middle School, Jenks West Intermediate Elementary School, and Jenks High School.
Ownership History
Date
Name
Owned For
Owner Type
Purchase Details
Closed on
Jul 25, 2014
Sold by
Hillock Scott D and Hillock Marina C
Bought by
The Hillock Family Revocable Trust
Current Estimated Value
Purchase Details
Closed on
Oct 11, 2006
Sold by
Clark John B and Clark Sarah E
Bought by
Hillock Scott and Hillock Marina C
Home Financials for this Owner
Home Financials are based on the most recent Mortgage that was taken out on this home.
Original Mortgage
$77,000
Outstanding Balance
$44,961
Interest Rate
6.26%
Mortgage Type
Unknown
Estimated Equity
$211,520
Purchase Details
Closed on
Aug 19, 2002
Sold by
Cendant Mobility Financial Corp
Bought by
Clark John B and Clark Sarah E
Purchase Details
Closed on
Aug 16, 2002
Sold by
Jackson Randell Herbert and Jackson Vicki D
Bought by
Cendant Mobility Financial Corp
Purchase Details
Closed on
Aug 1, 1986
Create a Home Valuation Report for This Property
The Home Valuation Report is an in-depth analysis detailing your home's value as well as a comparison with similar homes in the area
Home Values in the Area
Average Home Value in this Area
Purchase History
| Date | Buyer | Sale Price | Title Company |
|---|---|---|---|
| The Hillock Family Revocable Trust | -- | None Available | |
| Hillock Scott | $127,000 | Firstitle & Abstract Service | |
| Clark John B | $112,000 | Tulsa Abstract & Title Co | |
| Cendant Mobility Financial Corp | $112,000 | Tulsa Abstract & Title Co | |
| -- | $84,000 | -- |
Source: Public Records
Mortgage History
| Date | Status | Borrower | Loan Amount |
|---|---|---|---|
| Open | Hillock Scott | $77,000 |
Source: Public Records
Tax History Compared to Growth
Tax History
| Year | Tax Paid | Tax Assessment Tax Assessment Total Assessment is a certain percentage of the fair market value that is determined by local assessors to be the total taxable value of land and additions on the property. | Land | Improvement |
|---|---|---|---|---|
| 2024 | $2,252 | $17,448 | $2,050 | $15,398 |
| 2023 | $2,252 | $17,911 | $2,345 | $15,566 |
| 2022 | $2,250 | $16,389 | $2,911 | $13,478 |
| 2021 | $2,211 | $15,883 | $2,821 | $13,062 |
| 2020 | $2,097 | $15,390 | $2,733 | $12,657 |
| 2019 | $2,101 | $14,914 | $2,649 | $12,265 |
| 2018 | $2,034 | $14,450 | $2,645 | $11,805 |
| 2017 | $1,925 | $15,000 | $2,746 | $12,254 |
| 2016 | $1,872 | $14,563 | $2,761 | $11,802 |
| 2015 | $1,883 | $14,563 | $2,761 | $11,802 |
| 2014 | $1,819 | $13,970 | $2,761 | $11,209 |
Source: Public Records
Map
Nearby Homes
- 3133 W 69th Place S
- 3121 W 69th Place S
- 3102 W 70th St
- 6947 S 30th West Ave
- 3026 W 68th Place S
- 3308 W 68th St S
- 2922 W 65th St S
- 6507 S 29th Place W
- 2922 W 65th St
- 2917 W 65th St
- 6655 Riva Ridge Rd
- 2125 W 73rd St
- 7637 S 26th West Ave
- 7785 Forest Ln
- 7778 Forest Ln
- 1942 W 65th St
- 6101 S 33rd West Ave
- 3404 Redbud Ln
- 3402 Redbud Ln
- 3406 Redbud Ln
- 3040 W 69th Place
- 3050 W 69th Place
- 3043 W 70th St
- 3037 W 70th St
- 3034 W 69th Place
- 3049 W 70th St
- 3031 W 70th St
- 3056 W 69th Place
- 3045 W 69th Place
- 3039 W 69th Place S
- 3051 W 69th Place
- 6935 S 32nd West Ave
- 3000 W 69th Place S
- 3025 W 70th St
- 3028 W 69th Place
- 6943 S 32nd West Ave
- 3033 W 69th Place
- 3019 W 70th St
- 3040 W 70th St
- 3022 W 69th Place