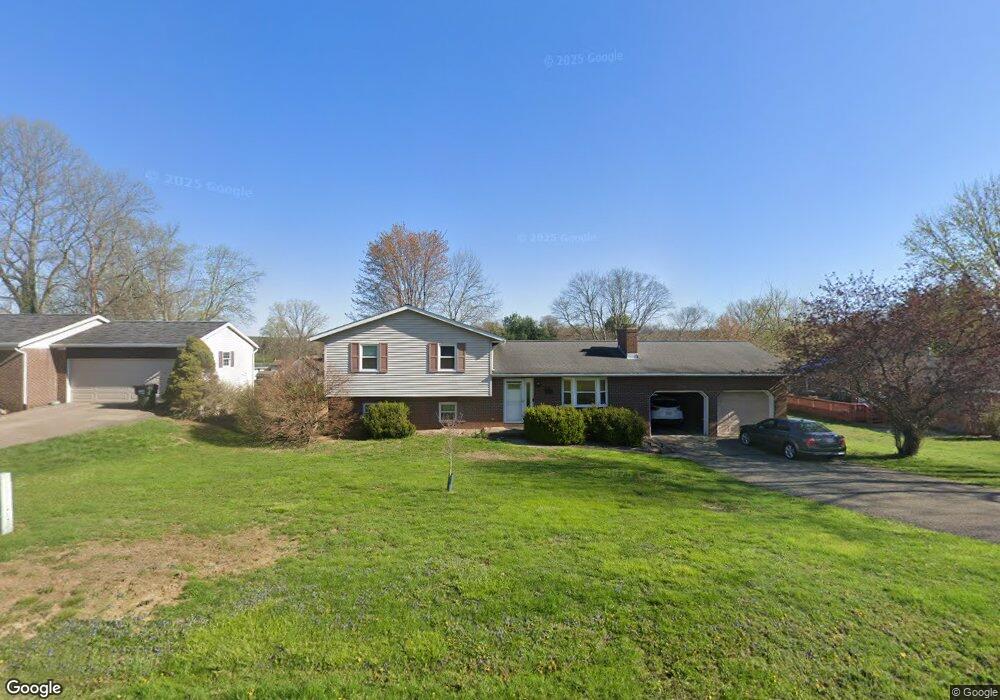
305 Kelly Cir Zanesville, OH 43701
Estimated Value: $325,000 - $380,000
4
Beds
3
Baths
1,742
Sq Ft
$199/Sq Ft
Est. Value
About This Home
This home is located at 305 Kelly Cir, Zanesville, OH 43701 and is currently estimated at $347,371, approximately $199 per square foot. 305 Kelly Cir is a home located in Muskingum County with nearby schools including West Muskingum High School and Zanesville SDA Elementary School.
Ownership History
Date
Name
Owned For
Owner Type
Purchase Details
Closed on
Feb 18, 2021
Sold by
Fell Kara L and Walsh Jonathan M
Bought by
Fell Kara L and Walsh Jonathan M
Current Estimated Value
Purchase Details
Closed on
Sep 24, 2013
Sold by
Bell Andrew J and Fell Kara L
Bought by
Fell Kara L
Purchase Details
Closed on
Sep 29, 2011
Sold by
Oldfield Lacey M and Dotson Lacey M
Bought by
Bell Andrew J and Bell Kara L
Home Financials for this Owner
Home Financials are based on the most recent Mortgage that was taken out on this home.
Original Mortgage
$119,920
Outstanding Balance
$81,948
Interest Rate
4.14%
Mortgage Type
New Conventional
Estimated Equity
$265,423
Purchase Details
Closed on
Jun 30, 2007
Sold by
Hill Tyler V
Bought by
Dotson Lacey M
Purchase Details
Closed on
May 16, 2007
Sold by
Augsburger Stanley W and Augsburger Nancy J
Bought by
Dotson Lacey M and Hill Tyler
Create a Home Valuation Report for This Property
The Home Valuation Report is an in-depth analysis detailing your home's value as well as a comparison with similar homes in the area
Home Values in the Area
Average Home Value in this Area
Purchase History
| Date | Buyer | Sale Price | Title Company |
|---|---|---|---|
| Fell Kara L | -- | None Available | |
| Fell Kara L | -- | None Available | |
| Bell Andrew J | $149,900 | None Available | |
| Dotson Lacey M | -- | Attorney | |
| Dotson Lacey M | $166,000 | Attorney |
Source: Public Records
Mortgage History
| Date | Status | Borrower | Loan Amount |
|---|---|---|---|
| Open | Bell Andrew J | $119,920 |
Source: Public Records
Tax History Compared to Growth
Tax History
| Year | Tax Paid | Tax Assessment Tax Assessment Total Assessment is a certain percentage of the fair market value that is determined by local assessors to be the total taxable value of land and additions on the property. | Land | Improvement |
|---|---|---|---|---|
| 2024 | $3,251 | $87,185 | $14,945 | $72,240 |
| 2023 | $2,577 | $62,335 | $8,610 | $53,725 |
| 2022 | $2,481 | $62,335 | $8,610 | $53,725 |
| 2021 | $2,455 | $62,335 | $8,610 | $53,725 |
| 2020 | $2,185 | $54,215 | $7,490 | $46,725 |
| 2019 | $2,191 | $54,215 | $7,490 | $46,725 |
| 2018 | $2,180 | $54,215 | $7,490 | $46,725 |
| 2017 | $2,017 | $48,615 | $7,490 | $41,125 |
| 2016 | $2,026 | $48,620 | $7,490 | $41,130 |
| 2015 | $2,092 | $48,620 | $7,490 | $41,130 |
| 2013 | $1,961 | $48,620 | $7,490 | $41,130 |
Source: Public Records
Map
Nearby Homes
- 300 Walker Dr
- 3845 Dresden Rd
- 3490 Regans Way
- 3425 Regans Way
- 1736 Forest Hills Cir
- 3790 Greenbriar Dr
- 3400 Dresden Rd
- 3705 Greenbriar Dr
- 0 Fairview Rd
- 975 Blossom Ln
- 3945 Mill Dr
- 1070 Richey Rd
- 1155 Griffiths Dr
- 0 Colony Park Ct
- 270 E Highland Dr
- 1136 Chatham Dr
- 1069 Terrace Ct
- 3125 E Highland Dr
- 3245 Circle Ct
- 1106 S Slope Bay
- 307 Kelly Cir
- 3967 Skyline Dr
- 304 Mel Kay Way
- 304 Kelly Cir
- 311 Kelly Cir
- 3985 Skyline Dr
- 308 Mel Kay Way
- 3970 Skyline Dr
- 312 Mel Kay Way
- 3976 Skyline Dr
- 3964 Skyline Dr
- 308 Kelly Cir
- 315 Kelly Cir
- 3949 Skyline Dr
- 3982 Skyline Dr
- 3958 Skyline Dr
- 312 Kelly Cir
- 3950 Skyline Dr
- 324 Mel Kay Way
- 323 Kelly Cir