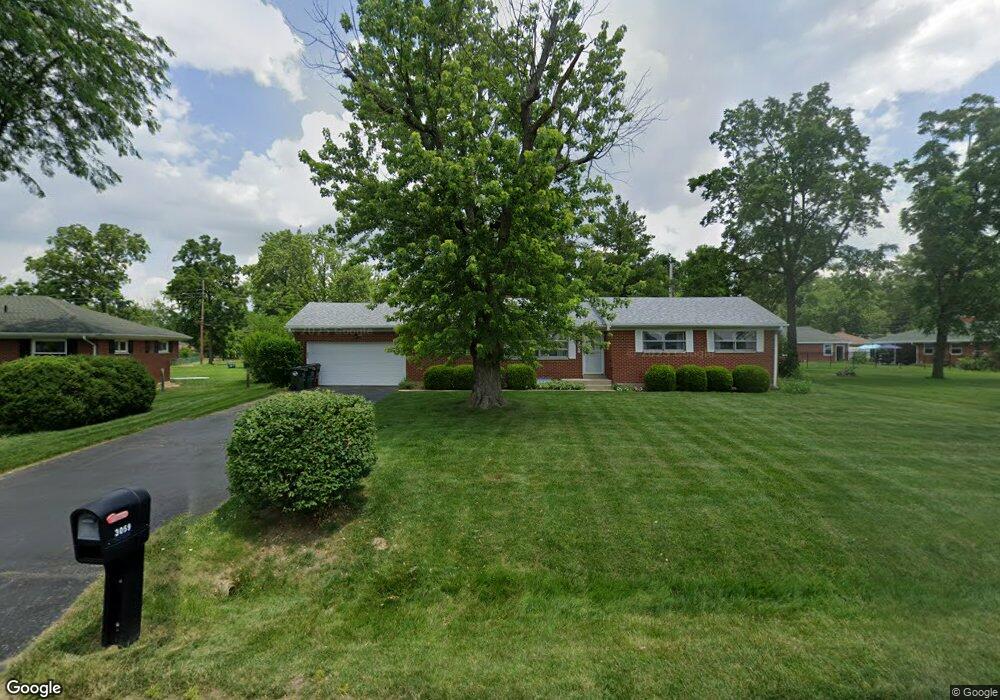
3059 Cricket Ln Dayton, OH 45414
Estimated Value: $230,000 - $307,619
3
Beds
2
Baths
1,421
Sq Ft
$182/Sq Ft
Est. Value
About This Home
This home is located at 3059 Cricket Ln, Dayton, OH 45414 and is currently estimated at $258,905, approximately $182 per square foot. 3059 Cricket Ln is a home located in Montgomery County with nearby schools including Demmitt Elementary School, Smith Middle School, and Butler High School.
Ownership History
Date
Name
Owned For
Owner Type
Purchase Details
Closed on
Aug 9, 2024
Sold by
Joeanna Hancock Irrevocable Trust and Furlong Karen
Bought by
Flick Ryan and Flick Mary
Current Estimated Value
Home Financials for this Owner
Home Financials are based on the most recent Mortgage that was taken out on this home.
Original Mortgage
$99,000
Outstanding Balance
$97,884
Interest Rate
6.89%
Mortgage Type
New Conventional
Estimated Equity
$161,021
Purchase Details
Closed on
Dec 20, 2012
Sold by
Smith John R and Lafollette Barbara A
Bought by
Hsd Of Central Indiana Llc
Purchase Details
Closed on
Dec 21, 2011
Sold by
Hancock Joeanna
Bought by
Furlong Karen
Purchase Details
Closed on
Nov 16, 2011
Sold by
Hancock Joeanna
Bought by
Furlong Karen
Purchase Details
Closed on
Jan 16, 1997
Sold by
Hancock Samuel J and Hancock Joeanna
Bought by
Hancock Samuel J and Hancock Joeanna
Create a Home Valuation Report for This Property
The Home Valuation Report is an in-depth analysis detailing your home's value as well as a comparison with similar homes in the area
Home Values in the Area
Average Home Value in this Area
Purchase History
| Date | Buyer | Sale Price | Title Company |
|---|---|---|---|
| Flick Ryan | $202,400 | None Listed On Document | |
| Hsd Of Central Indiana Llc | -- | None Available | |
| Furlong Karen | -- | None Available | |
| Furlong Karen | -- | None Available | |
| Hancock Samuel J | -- | -- |
Source: Public Records
Mortgage History
| Date | Status | Borrower | Loan Amount |
|---|---|---|---|
| Open | Flick Ryan | $99,000 |
Source: Public Records
Tax History Compared to Growth
Tax History
| Year | Tax Paid | Tax Assessment Tax Assessment Total Assessment is a certain percentage of the fair market value that is determined by local assessors to be the total taxable value of land and additions on the property. | Land | Improvement |
|---|---|---|---|---|
| 2024 | $3,373 | $63,140 | $14,330 | $48,810 |
| 2023 | $3,373 | $63,140 | $14,330 | $48,810 |
| 2022 | $3,132 | $48,580 | $11,030 | $37,550 |
| 2021 | $3,133 | $48,580 | $11,030 | $37,550 |
| 2020 | $3,118 | $48,580 | $11,030 | $37,550 |
| 2019 | $1,903 | $30,890 | $12,680 | $18,210 |
| 2018 | $2,955 | $43,040 | $12,680 | $30,360 |
| 2017 | $2,935 | $43,040 | $12,680 | $30,360 |
| 2016 | $2,525 | $37,580 | $11,030 | $26,550 |
| 2015 | $2,398 | $37,580 | $11,030 | $26,550 |
| 2014 | $2,398 | $37,580 | $11,030 | $26,550 |
| 2012 | -- | $37,600 | $10,890 | $26,710 |
Source: Public Records
Map
Nearby Homes
- 7184 Brantford Rd
- 7052 Society Ct
- 7019 Brantford Rd
- 7042 Society Ct
- 6810 Trailview Dr
- 3166 Little York Rd
- 3114 Northerton Ct
- 7562 Yorkshire Dr
- 7568 Yorkshire Dr
- 7227 Gardenside Dr
- Johnstown Plan at Yorkshire Reserve - The Oaks at Yorkshire Reserve
- Newcastle Plan at Yorkshire Reserve - The Oaks at Yorkshire Reserve
- Bellamy Plan at Yorkshire Reserve - The Oaks at Yorkshire Reserve
- Milford Plan at Yorkshire Reserve - The Oaks at Yorkshire Reserve
- Holcombe Plan at Yorkshire Reserve - The Oaks at Yorkshire Reserve
- Chatham Plan at Yorkshire Reserve - The Oaks at Yorkshire Reserve
- 7612 Turtleback Dr
- 3600 Little York Rd
- 6501 Woodville Dr
- 7420 New York Way
- 3039 Cricket Ln
- 3079 Cricket Ln
- 7211 Norita Ct
- 3060 Cricket Ln
- 3019 Cricket Ln
- 3020 Cricket Ln
- 7221 Norita Ct
- 3080 Cricket Ln
- 7234 Yorkshire Dr
- 7300 Yorkshire Dr
- 7172 Yorkshire Dr
- 3105 Cricket Ln
- 3100 Cricket Ln
- 7231 Norita Ct
- 7210 Norita Ct
- 7312 Yorkshire Dr
- 7142 Yorkshire Dr
- 7195 Yorkshire Dr
- 7233 Yorkshire Dr
- 7230 Norita Ct