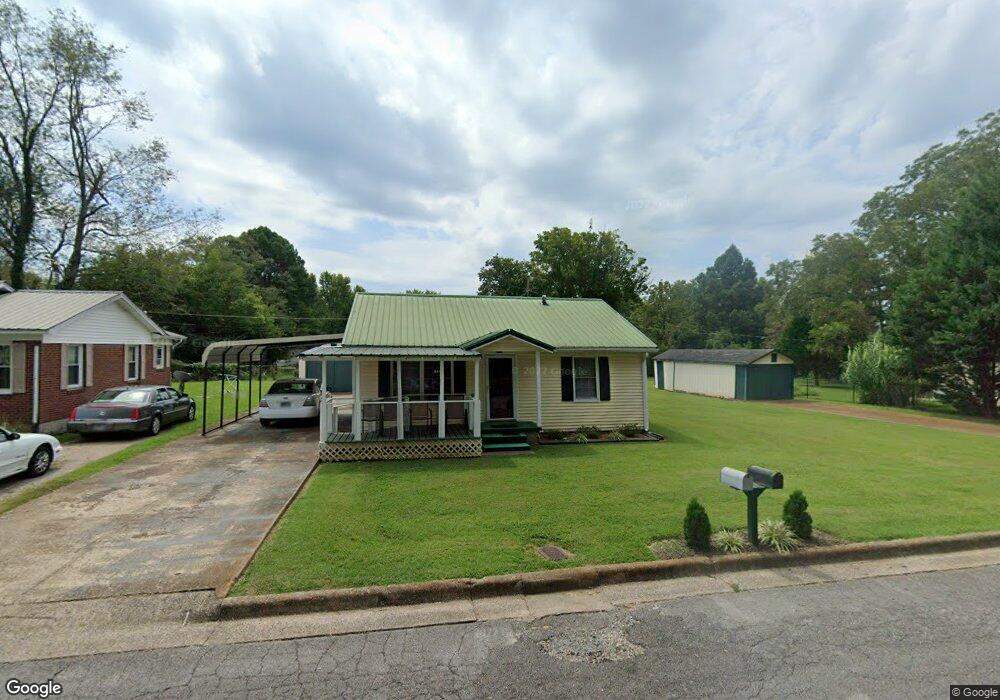
307 Simpson St Lawrenceburg, TN 38464
Estimated Value: $100,157 - $179,000
--
Bed
1
Bath
868
Sq Ft
$173/Sq Ft
Est. Value
About This Home
This home is located at 307 Simpson St, Lawrenceburg, TN 38464 and is currently estimated at $150,539, approximately $173 per square foot. 307 Simpson St is a home located in Lawrence County with nearby schools including Ingram Sowell Elementary School, David Crockett Elementary School, and Lawrenceburg Public Elementary School.
Ownership History
Date
Name
Owned For
Owner Type
Purchase Details
Closed on
Oct 1, 2025
Sold by
Osborn William T and Osborn Christine R
Bought by
Osborn William T and Osborn Tony
Current Estimated Value
Purchase Details
Closed on
Mar 10, 2025
Sold by
Osborn William T
Bought by
Osborn William T and Osborn Tony
Purchase Details
Closed on
Dec 4, 2009
Sold by
Osborn William T
Bought by
Osborn Christine R
Purchase Details
Closed on
Oct 3, 1978
Bought by
Osborn William T
Create a Home Valuation Report for This Property
The Home Valuation Report is an in-depth analysis detailing your home's value as well as a comparison with similar homes in the area
Home Values in the Area
Average Home Value in this Area
Purchase History
| Date | Buyer | Sale Price | Title Company |
|---|---|---|---|
| Osborn William T | -- | None Listed On Document | |
| Osborn William T | -- | None Listed On Document | |
| Osborn William T | -- | None Listed On Document | |
| Osborn Christine R | -- | -- | |
| Osborn William T | -- | -- |
Source: Public Records
Tax History Compared to Growth
Tax History
| Year | Tax Paid | Tax Assessment Tax Assessment Total Assessment is a certain percentage of the fair market value that is determined by local assessors to be the total taxable value of land and additions on the property. | Land | Improvement |
|---|---|---|---|---|
| 2025 | -- | $19,250 | $0 | $0 |
| 2024 | -- | $19,250 | $1,875 | $17,375 |
| 2023 | $598 | $19,250 | $1,875 | $17,375 |
| 2022 | $598 | $19,250 | $1,875 | $17,375 |
| 2021 | $471 | $10,725 | $1,500 | $9,225 |
| 2020 | $471 | $10,725 | $1,500 | $9,225 |
| 2019 | $471 | $10,725 | $1,500 | $9,225 |
| 2018 | $471 | $10,725 | $1,500 | $9,225 |
| 2017 | $471 | $10,725 | $1,500 | $9,225 |
| 2016 | $471 | $10,725 | $1,500 | $9,225 |
| 2015 | $446 | $10,725 | $1,500 | $9,225 |
| 2014 | $442 | $10,625 | $1,500 | $9,125 |
Source: Public Records
Map
Nearby Homes