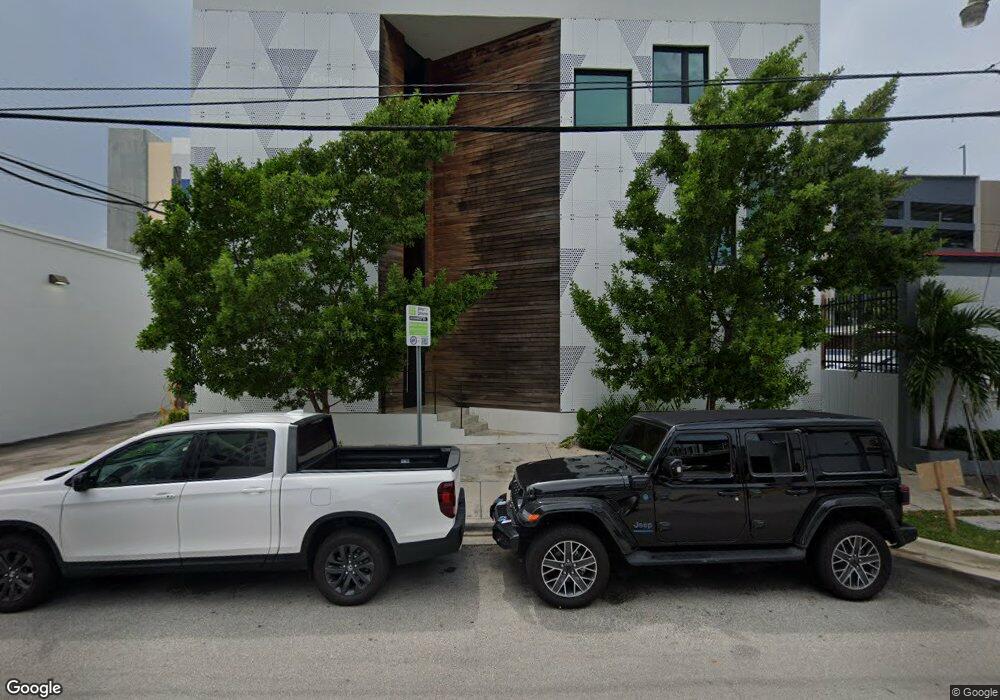
3070 SW 38th Ct Miami, FL 33146
Southeast Gables NeighborhoodEstimated Value: $8,844,832
--
Bed
--
Bath
12,354
Sq Ft
$716/Sq Ft
Est. Value
About This Home
This home is located at 3070 SW 38th Ct, Miami, FL 33146 and is currently estimated at $8,844,832, approximately $715 per square foot. 3070 SW 38th Ct is a home located in Miami-Dade County with nearby schools including Frances S. Tucker Elementary School, Ponce de Leon Middle School, and Coral Gables Senior High School.
Ownership History
Date
Name
Owned For
Owner Type
Purchase Details
Closed on
May 14, 2021
Sold by
Hjc Cave Llc
Bought by
Greyson Holdings 3070 Llc
Current Estimated Value
Home Financials for this Owner
Home Financials are based on the most recent Mortgage that was taken out on this home.
Original Mortgage
$2,000,000
Outstanding Balance
$1,812,499
Interest Rate
3.1%
Mortgage Type
Commercial
Estimated Equity
$7,032,333
Purchase Details
Closed on
Dec 7, 2015
Sold by
Victorias Armoire Inc
Bought by
Hjc Cave Llc
Purchase Details
Closed on
Nov 4, 1996
Sold by
Animal Welfare Society Of S Fl
Bought by
Victoria'S Armoire Inc
Home Financials for this Owner
Home Financials are based on the most recent Mortgage that was taken out on this home.
Original Mortgage
$251,250
Interest Rate
8.15%
Mortgage Type
Commercial
Create a Home Valuation Report for This Property
The Home Valuation Report is an in-depth analysis detailing your home's value as well as a comparison with similar homes in the area
Home Values in the Area
Average Home Value in this Area
Purchase History
| Date | Buyer | Sale Price | Title Company |
|---|---|---|---|
| Greyson Holdings 3070 Llc | $4,700,000 | Attorney | |
| Hjc Cave Llc | $1,350,000 | Attorney | |
| Victoria'S Armoire Inc | $335,000 | -- |
Source: Public Records
Mortgage History
| Date | Status | Borrower | Loan Amount |
|---|---|---|---|
| Open | Greyson Holdings 3070 Llc | $2,000,000 | |
| Previous Owner | Victoria'S Armoire Inc | $251,250 |
Source: Public Records
Tax History Compared to Growth
Tax History
| Year | Tax Paid | Tax Assessment Tax Assessment Total Assessment is a certain percentage of the fair market value that is determined by local assessors to be the total taxable value of land and additions on the property. | Land | Improvement |
|---|---|---|---|---|
| 2025 | $62,014 | $3,089,288 | $2,480,775 | $608,513 |
| 2024 | $60,573 | $3,095,560 | $2,480,775 | $614,785 |
| 2023 | $60,573 | $2,887,113 | $0 | $0 |
| 2022 | $54,108 | $2,624,649 | $2,029,725 | $594,924 |
| 2021 | $43,125 | $2,029,725 | $2,029,725 | $0 |
| 2020 | $42,558 | $2,029,725 | $2,029,725 | $0 |
| 2019 | $40,096 | $2,029,725 | $2,029,725 | $0 |
| 2018 | $42,241 | $2,317,782 | $2,156,625 | $161,157 |
| 2017 | $32,394 | $1,473,596 | $0 | $0 |
| 2016 | $29,238 | $1,339,633 | $0 | $0 |
| 2015 | $20,515 | $841,690 | $0 | $0 |
| 2014 | $19,832 | $765,173 | $0 | $0 |
Source: Public Records
Map
Nearby Homes
- 4241 Aurora St Unit 505
- 4241 Aurora St Unit 701
- 4241 Aurora St Unit 703
- 4100 Salzedo St Unit 916
- 4100 Salzedo St Unit 816
- 4100 Salzedo St Unit 919
- 4100 Salzedo St Unit 411
- 4100 Salzedo St Unit 618
- 4100 Salzedo St Unit 409
- 4100 Salzedo St Unit 515
- 243 Velarde Ave
- 236 Candia Ave
- 124 George Allen Ave
- 301 Altara Ave Unit 419
- 301 Altara Ave Unit 914
- 301 Altara Ave Unit 1008
- 301 Altara Ave Unit LPH903
- 301 Altara Ave Unit 805
- 301 Altara Ave Unit 201
- 301 Altara Ave Unit 511
- 3050 SW 38th Ct
- 3075 SW 39th Ave
- 3095 SW 39th Ave
- 3811 Shipping Ave Unit FL2-ID125
- 3811 Shipping Ave Unit 1411
- 3811 Shipping Ave Unit 506
- 3811 Shipping Ave Unit 1811
- 3811 Shipping Ave Unit 1706
- 3811 Shipping Ave Unit 406
- 3811 Shipping Ave
- 3880 Bird Rd Unit 422
- 3880 Bird Rd Unit B8
- 3880 Bird Rd
- 3880 Bird Rd Unit B4
- 3880 Bird Rd Unit A1-A6
- 3880 Bird Rd
- 3880 Bird Rd Unit S3
- 3880 Bird Rd Unit B6
- 3880 Bird Rd Unit A3
- 3880 Bird Rd Unit B12