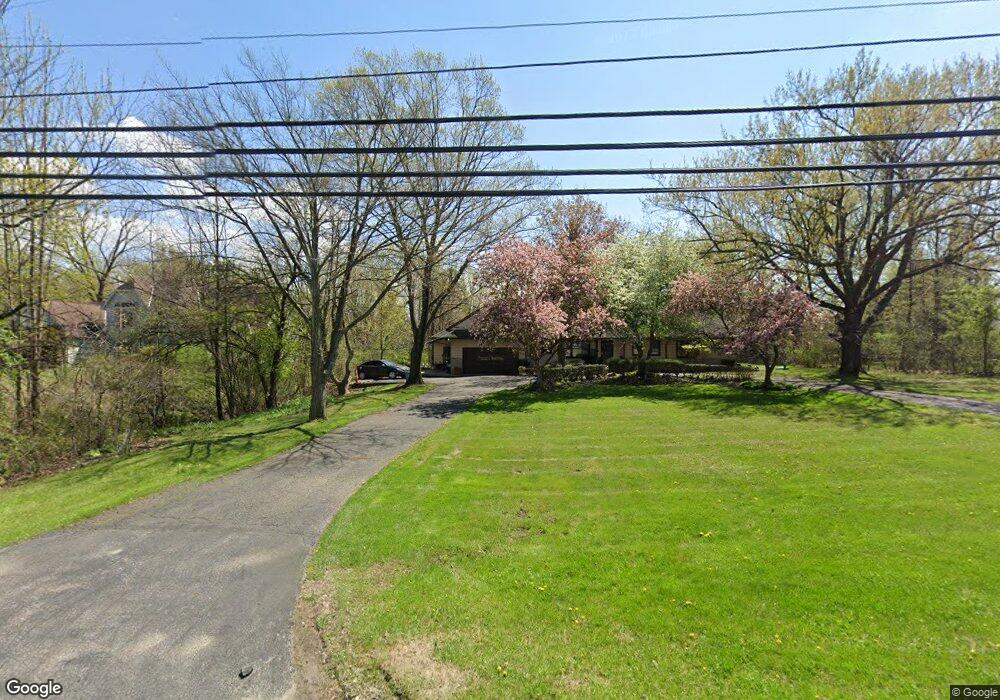
30726 Cedar Rd Cleveland, OH 44124
Estimated Value: $407,840 - $535,000
3
Beds
2
Baths
2,550
Sq Ft
$188/Sq Ft
Est. Value
About This Home
This home is located at 30726 Cedar Rd, Cleveland, OH 44124 and is currently estimated at $479,210, approximately $187 per square foot. 30726 Cedar Rd is a home located in Cuyahoga County with nearby schools including Moreland Hills Elementary School, Ballard Brady Middle School, and Orange High School.
Ownership History
Date
Name
Owned For
Owner Type
Purchase Details
Closed on
Mar 27, 2006
Sold by
Mcqueen James F and Mcqueen Ola
Bought by
Mcqueen James F and Mcqueen Ola
Current Estimated Value
Purchase Details
Closed on
May 23, 1996
Sold by
Jain Mohan R
Bought by
Mcqueen James F
Home Financials for this Owner
Home Financials are based on the most recent Mortgage that was taken out on this home.
Original Mortgage
$180,000
Outstanding Balance
$10,350
Interest Rate
8.1%
Mortgage Type
New Conventional
Estimated Equity
$468,860
Purchase Details
Closed on
Jan 18, 1995
Sold by
Sheriff Of Cuyahoga Coun
Bought by
Jain Mohan R and Jain Sevanti M
Purchase Details
Closed on
Apr 5, 1979
Sold by
Kondas John E
Bought by
Warner Charlene M
Purchase Details
Closed on
Jul 19, 1976
Sold by
Parr Jas N and Parr Louise A
Bought by
Kondas John E
Purchase Details
Closed on
Jan 1, 1975
Bought by
Parr Jas N and Parr Louise A
Create a Home Valuation Report for This Property
The Home Valuation Report is an in-depth analysis detailing your home's value as well as a comparison with similar homes in the area
Home Values in the Area
Average Home Value in this Area
Purchase History
| Date | Buyer | Sale Price | Title Company |
|---|---|---|---|
| Mcqueen James F | -- | None Available | |
| Mcqueen James F | $225,000 | -- | |
| Jain Mohan R | $165,500 | -- | |
| Warner Charlene M | $96,100 | -- | |
| Kondas John E | $75,000 | -- | |
| Parr Jas N | -- | -- |
Source: Public Records
Mortgage History
| Date | Status | Borrower | Loan Amount |
|---|---|---|---|
| Open | Mcqueen James F | $180,000 |
Source: Public Records
Tax History Compared to Growth
Tax History
| Year | Tax Paid | Tax Assessment Tax Assessment Total Assessment is a certain percentage of the fair market value that is determined by local assessors to be the total taxable value of land and additions on the property. | Land | Improvement |
|---|---|---|---|---|
| 2024 | $8,149 | $138,635 | $28,420 | $110,215 |
| 2023 | $7,711 | $109,340 | $33,530 | $75,810 |
| 2022 | $7,723 | $109,340 | $33,530 | $75,810 |
| 2021 | $7,649 | $109,340 | $33,530 | $75,810 |
| 2020 | $7,693 | $102,170 | $31,330 | $70,840 |
| 2019 | $7,409 | $291,900 | $89,500 | $202,400 |
| 2018 | $7,366 | $102,170 | $31,330 | $70,840 |
| 2017 | $7,644 | $101,330 | $26,880 | $74,450 |
| 2016 | $7,561 | $101,330 | $26,880 | $74,450 |
| 2015 | $7,190 | $101,330 | $26,880 | $74,450 |
| 2014 | $7,190 | $96,500 | $25,590 | $70,910 |
Source: Public Records
Map
Nearby Homes
- 30776 Cedar Rd
- 31000 Cedar Rd
- S/L 1 Bridgeport Way
- 43 Bridgeport Way
- 46 Bridgeport Way
- 30700 Ainsworth Dr
- 2522 Edgewood Trace
- 2540 Edgewood Trace
- 2401 Edgewood Trace
- 2405 Edgewood Trace
- 2431 Edgewood Trace
- 2422 Edgewood Trace
- 31799 Gates Mills Blvd
- 29999 Fairmount Blvd
- 5960 Cantwell Dr
- 2392 Arlington Dr Unit 2392
- 29799 Fairmount Blvd
- 5814 Tiffany Ct
- 5824 Tiffany Ct Unit 5824
- 5706 York Dr Unit 5706
- 2411 Lander Rd
- 30600 Cedar Rd
- 30850 Cedar Rd
- 1 Louis Dr
- 2425 Lander Rd
- 156 Bridgeport Way
- 146 Bridgeport Way
- 160 Bridgeport Way
- 2 Louis Dr
- 142 Bridgeport Way
- 2441 Lander Rd
- 138 Bridgeport Way
- 164 Bridgeport Way
- 30926 Cedar Rd
- S/L 4 Bridgeport Way
- 147 Bridgeport Way
- 3 Louis Dr
- 134 Bridgeport Way
- 2459 Lander Rd
- 8 Louis Dr